- Search Crypto Craft
- 157 Results (2 Threads , 155 Replies )
-
 TheSnowman replied Jun 11, 2011
Oh deary — Summary: Do not trade every green cross red Your opinion counts for naught How to get 1 Vouch? He is from Netherlands so probably a nice guy
Trading Made Simpler
- TheSnowman replied Jun 11, 2011
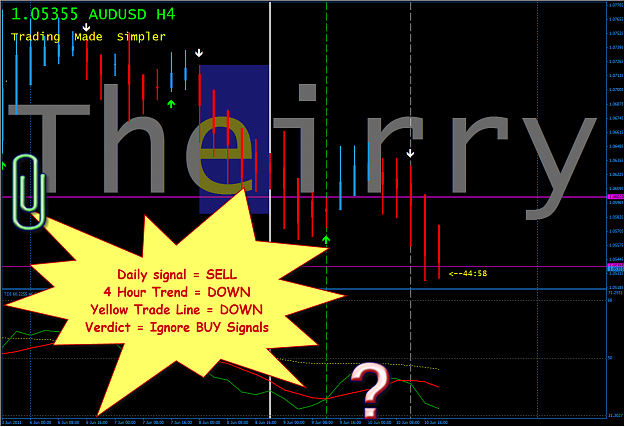
A good example — Here is an example of what I am talking about; how to use the higher time frame signals to keep you out of losing trades. Every time there is a 4 Hour cross, you can be sure someone is trying to trade it
Trading Made Simpler Also: keep ...
- TheSnowman replied Jun 10, 2011
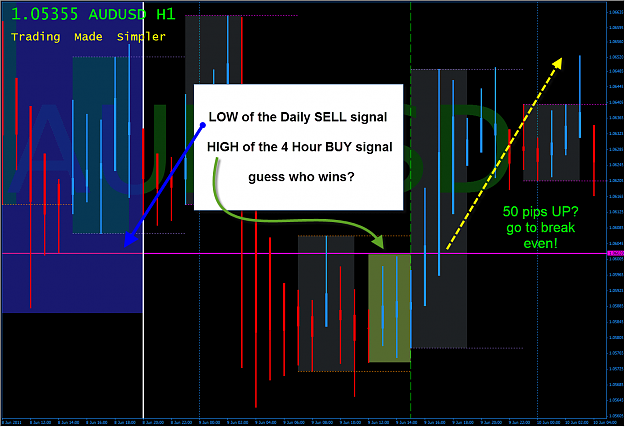
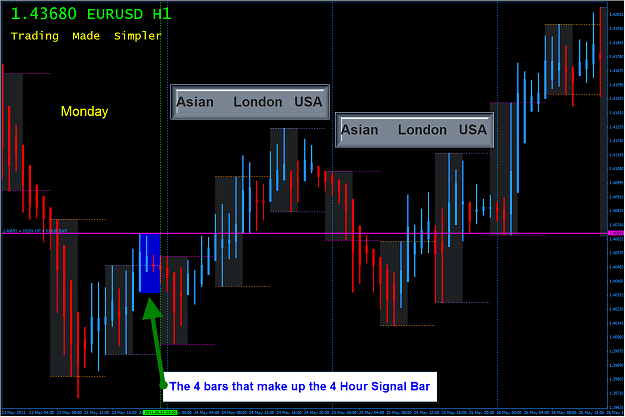
1 Hour Chart — Let's zoom into the 1 hour chart on Tuesday, you can see that there was plenty of opportunity to enter during the London session, and even more time on Wednesday for that matter. The way I intend to look at these trades, is ...
Trading Made Simpler
- TheSnowman replied Jun 10, 2011
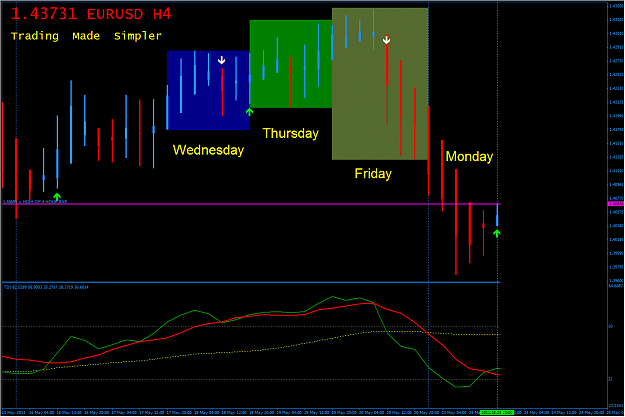
4-Hour Chart Monday — Here the chart after Monday close, there is a 4 hour TDI signal, the green line crossed the red line, and indicated by the green arrow on that bar. The high of that bar is marked by the magenta horizontal line
Trading Made Simpler
- TheSnowman replied Jun 10, 2011
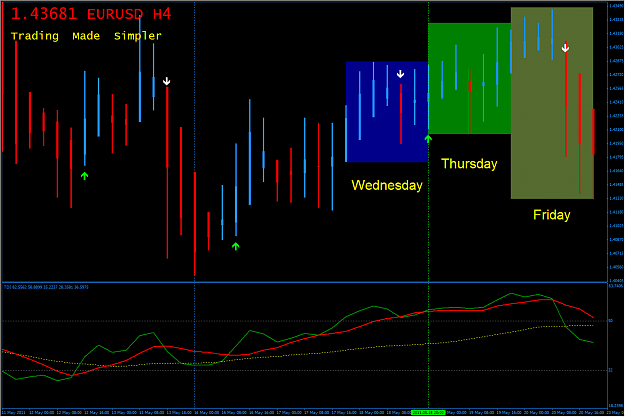
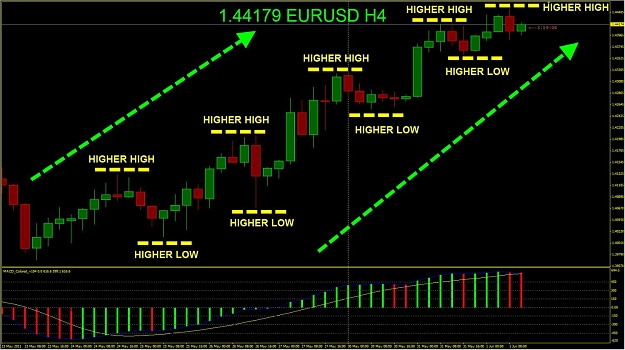
4-Hour Chart Friday — I have high lighted the 6 x 4 hour bars that make up the DAILY bar that gave the Primary Long Signal. Coincidentally, that is a 4 hour signal at the same time as shown by the green arrow. As you can see, both the green ...
Trading Made Simpler
- TheSnowman replied Jun 10, 2011
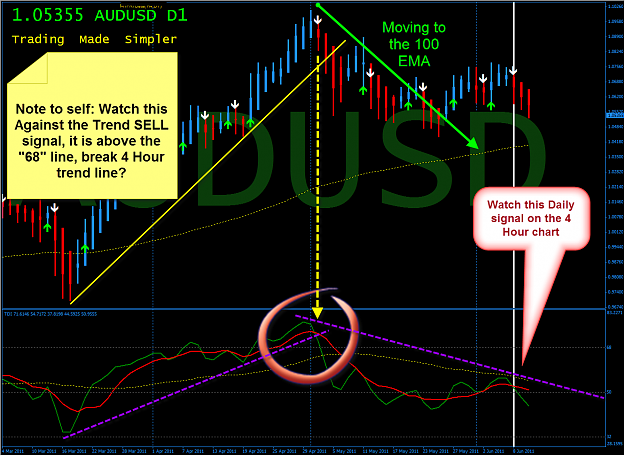
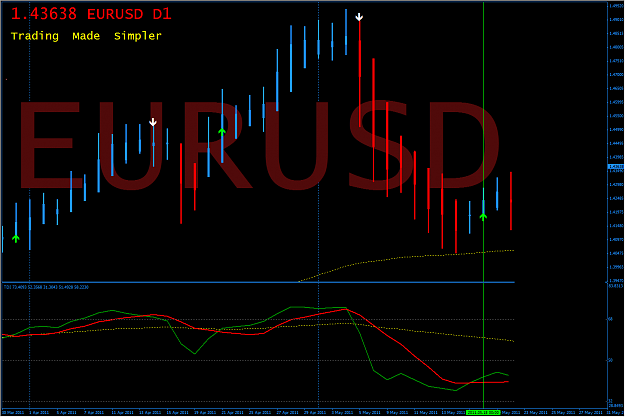
DAILY CHART — OK, on 5-18-2011 the TDI crosses over shown by the arrow placed by the TDI Arrow Indicator. I placed a green vertical line on the chart, which helps confirm the position on the 4 hour chart That was a Wednesday, let's zoom into ...
Trading Made Simpler
- TheSnowman replied Jun 10, 2011
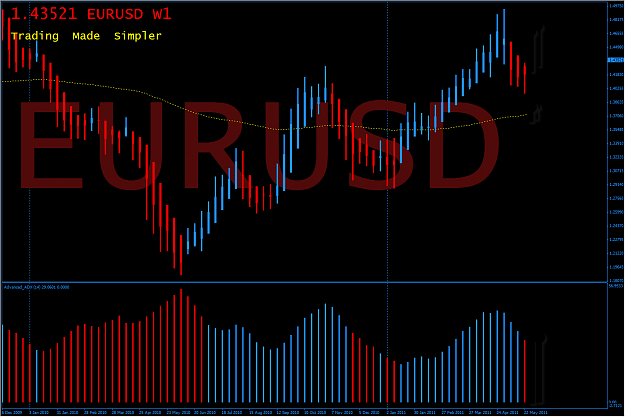
WEEKLY CHART — Weekly chart, I think if you are Elliot Wave, you would be happy with that up movement! Great higher highs and lower lows so far. There is retracement, maybe back to the 100 EMA? and there were 2 previous pullback also, ADX has ...
Trading Made Simpler
- TheSnowman replied Jun 10, 2011
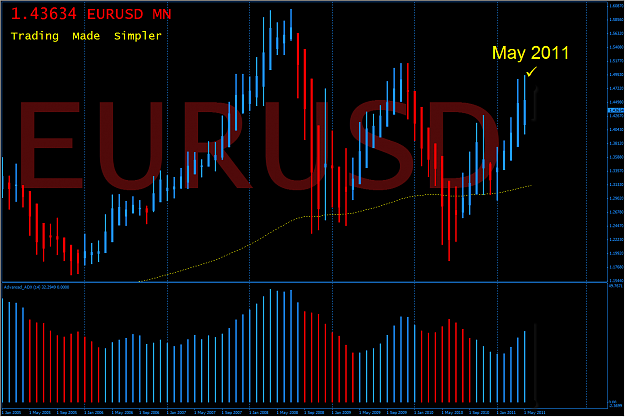
Monthly CHART — As I post these charts, I will also post the routine list of questions that I run over as I look at the chart; obviously, you don’t have to do this every day for the monthly & weekly charts. Also, I have not marked up any ...
Trading Made Simpler
- TheSnowman replied Jun 1, 2011
This is the site before; perhaps they will return it once the sale is over?
Line Trader *EA*

- TheSnowman replied Jun 1, 2011
Time Check..... — ......... or time warp? it is June 1, 2011 right?
GoMarkets Discussion

- TheSnowman replied Jun 1, 2011
All righty then (Jim Carrey) — let me guess, you were using the "pick the top" method instead of the "buy dips, and go with the trend" method? Sorry if this seems a bit blunt, but you gave no clue as to the point of your post, question, ...
4 Hour Strategy (MACD)
- TheSnowman replied Jun 1, 2011
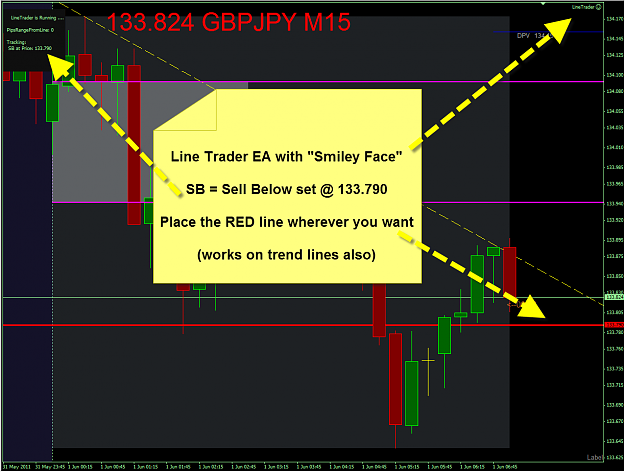
Line Trader *EA* — Folks, are you always missing those breakouts?
Line Trader *EA* Have you ever looked at a chart, put your support, resistance or trend line on there and told yourself that is where you will take the trade, then look at other ...

- Line Trader *EA*Started Jun 1, 2011|Commercial Content|37 replies

Folks, are you always missing those breakouts?
Have you ever looked at a chart, put your ...
- TheSnowman replied May 31, 2011
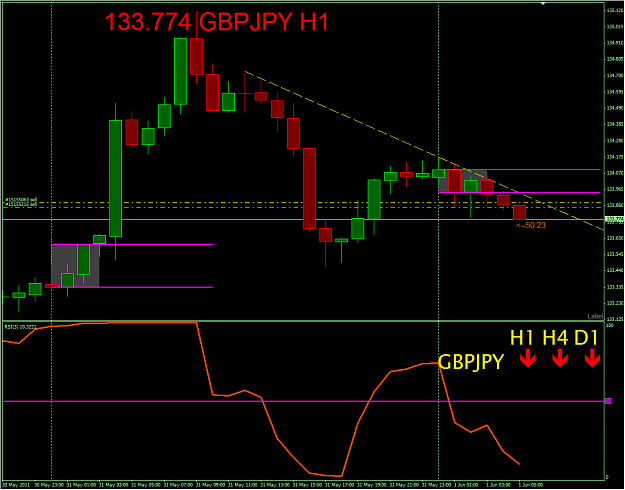
How about this? — ............4H 3 Tap (but last 4 H not complete, could turn right around) + 1 H breakout, anyone aboard, you can still catch it, watch the Daily trend line UP and 100 SMA, but if it clears those, it will continue the lower ...
Trade What You See - Almost Naked Trading
- TheSnowman replied May 21, 2011
Well, as long as that is 2% of your account, shouldn't hurt too bad........ on second thoughts ............
GoMarkets Discussion

- TheSnowman replied May 17, 2011
why.buy.jpy — He was reading his crystal ball, I think
4 Hour Strategy (MACD)
- TheSnowman replied May 13, 2011
DIY — TO: everyone asking about daily progress report, very easy to calculate when the entry is known, as per 1st post, Stop Loss = 100, Take Profit = 125 So, SL is 132.525 and TP is 130.275, I am making the assumption that you are actually ...
GBPJPY Daily Trend Method
- TheSnowman replied May 11, 2011
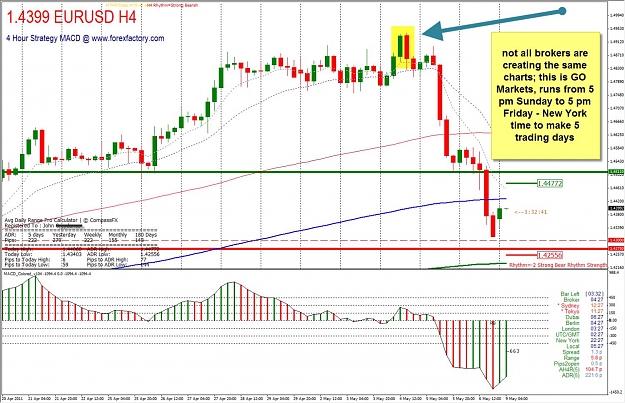
I think that is correct GMT, I just go by the times on my broker's chart (GO Markets). Here is a chart showing today price action; perhaps Phillip Nel can confirm that there is a SELL signal after the 12:00 candle? That was about 2 hours ago; I am ...
4 Hour Strategy (MACD)
- TheSnowman replied May 8, 2011
Yes, but.......... — With all due respect, not all brokers platform will show that "tail" pattern I guess it is a matter of recognizing the same price action but displayed as "railroad track" pattern?
4 Hour Strategy (MACD)
- TheSnowman replied May 2, 2011
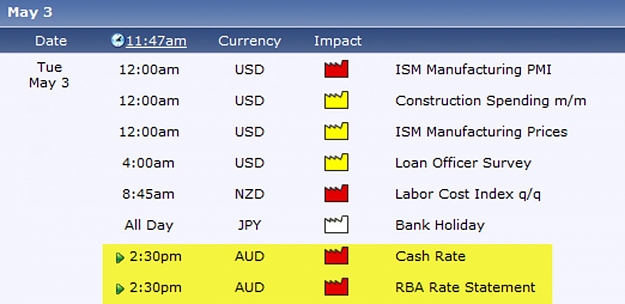
News — About 2-1/2 hours until Aus interest rates announcement!
Trade What You See - Almost Naked Trading