- Search Crypto Craft
- 75 Results (1 Thread , 74 Replies )
-
 The Rhodie replied Jan 23, 2014
I suppose you mean a side view of a tombstone? Tombstones are many shapes, like angels, vehicles, even a taper! So it makes even less sense to me now than before. Here's a real tombstone, so what are you referring to? image
XAU/USD & XAG/USD - Gold & Silver Traders Thread
- Learning live account trades with The Rhodie (Fibonacci, etc)Started Jan 17, 2014|Interactive Trading|3 replies

This is a place to learn about the markets and what it means to trade on them (not in them). My ...

- The Rhodie replied Jan 17, 2014
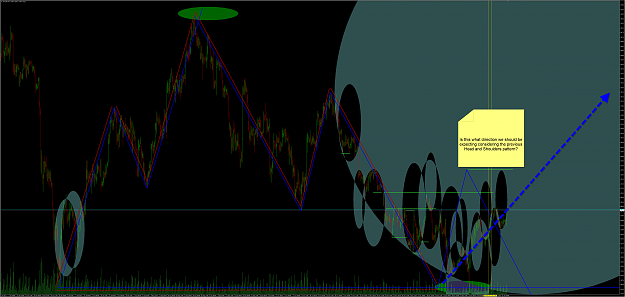
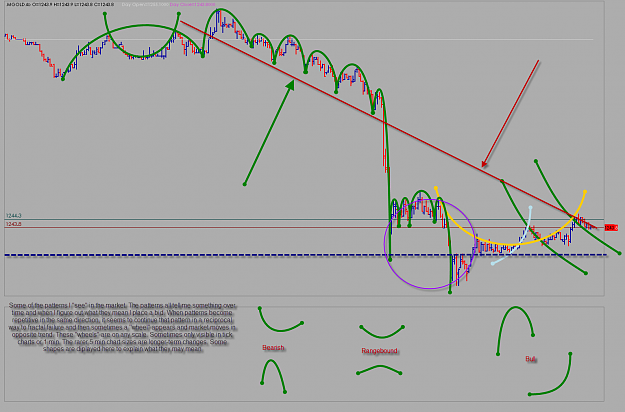
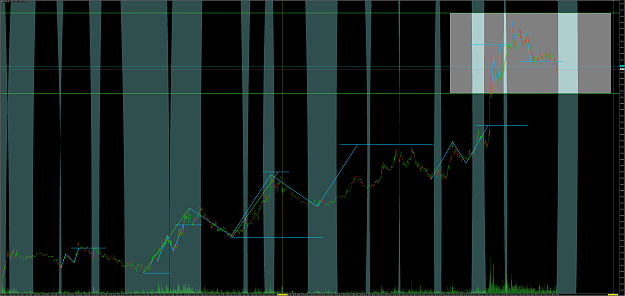
As an update to the week in review: I am wondering if what we are looking at is a bull run possibility fro the coming weeks. WHY? image If we look back over the past year, we notice that the entire trend has been downwards, however towards the end ...
XAU/USD & XAG/USD - Gold & Silver Traders Thread

- The Rhodie replied Jan 17, 2014
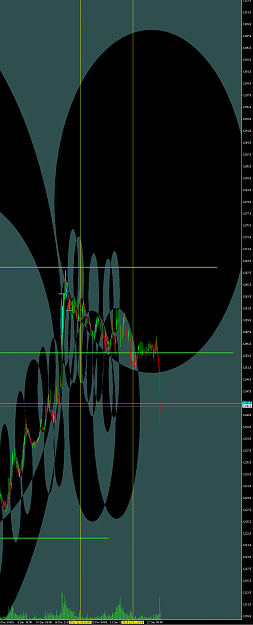
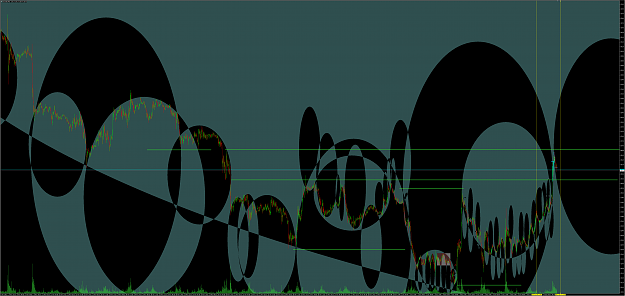
It could be, but we need a couple trading days worth of history to show us that that statement is true. Here's a current snapshot of where the market stands on an H4 chart image And trhen on a larger time span... image
XAU/USD & XAG/USD - Gold & Silver Traders Thread
- The Rhodie replied Jan 10, 2014
Many people are looking to trade NFP moves, but that is really dangerous. It goes with the trend which is almost never in a straight line.
XAU/USD & XAG/USD - Gold & Silver Traders Thread
- The Rhodie replied Jan 10, 2014
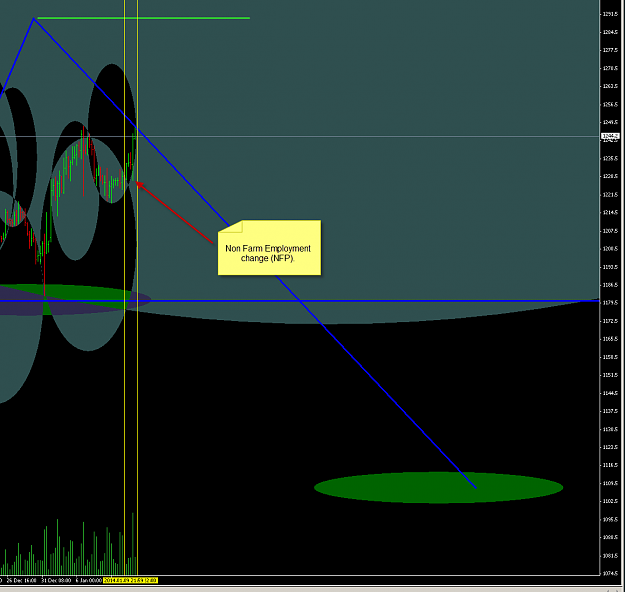
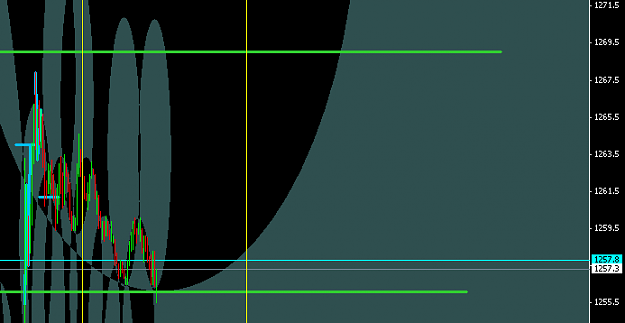
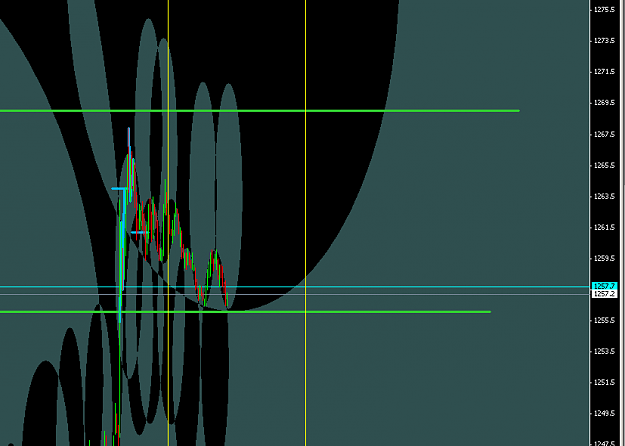
image The current move is an extension of a larger move that has continued from 6th Jan which was an inside move from 31 Dec 2013. I does not look like that gold has topped out yet and could easily go longer from 1244. That being the case, ...
XAU/USD & XAG/USD - Gold & Silver Traders Thread
- The Rhodie replied Jan 6, 2014
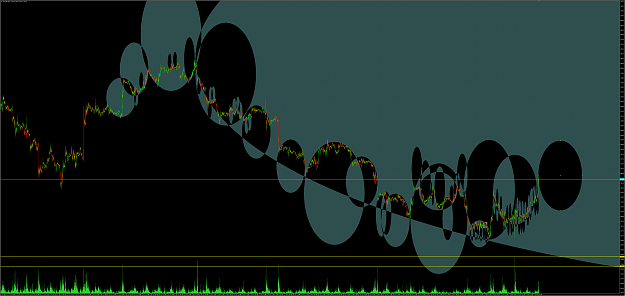
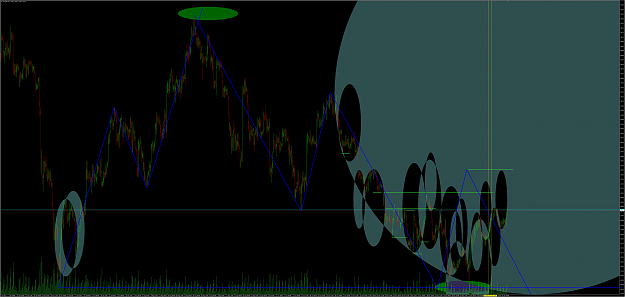
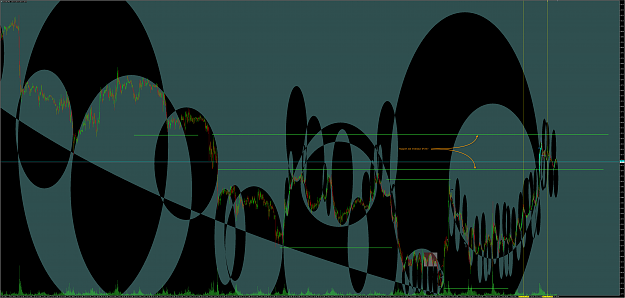
Here is an update from the bubble trends. What can you see from the current view? It looks like everything is as should bee for a bull run, but has gold bottomed? Not likely, but there is no bottom to be seeking, just a level of support that becomes ...
XAU/USD & XAG/USD - Gold & Silver Traders Thread
- The Rhodie replied Dec 28, 2013
Hello everyone. Here is a little reminder to those of you who last looked at my posts: I warned before Christmas that there was likely to be a drop in the price of gold and actuall y posted an image that showed how likely that was to be. It dropped ...
XAU/USD & XAG/USD - Gold & Silver Traders Thread
- The Rhodie replied Dec 17, 2013
hello all. A quick warning...
XAU/USD & XAG/USD - Gold & Silver Traders Thread
- The Rhodie replied Dec 17, 2013
See how the daily traders work their magic and then move their positions along day by day. over the whole move of the past few days there has been a big fund involved and it is about to finish for the week. When they TP out, the market will move ...
XAU/USD & XAG/USD - Gold & Silver Traders Thread
- The Rhodie replied Dec 17, 2013
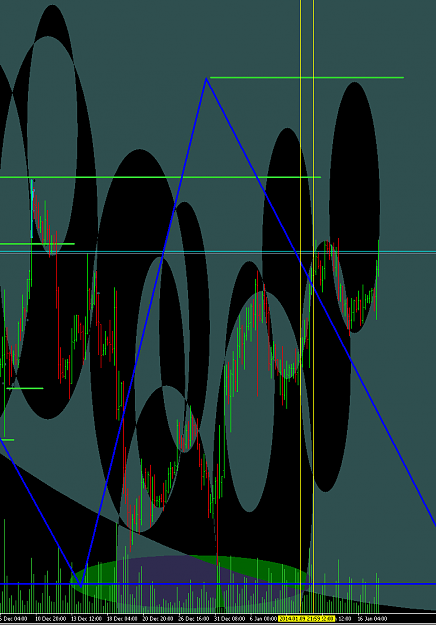
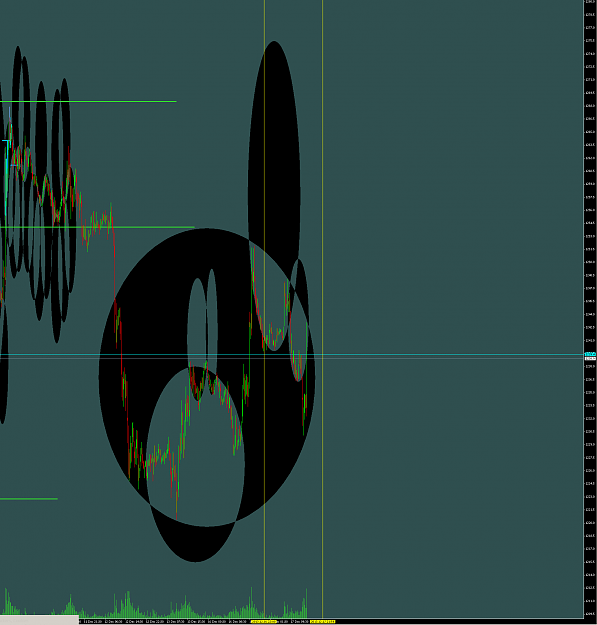
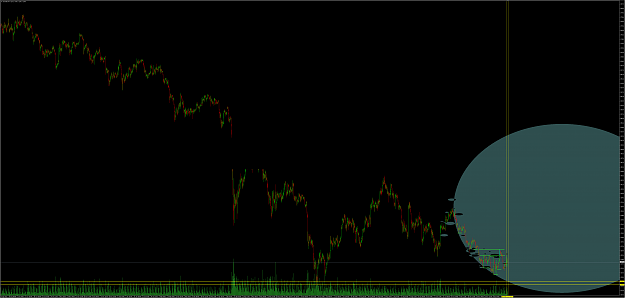
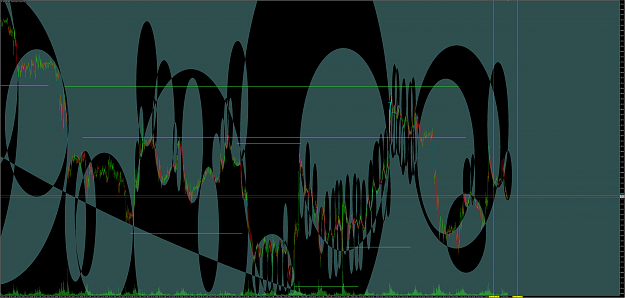
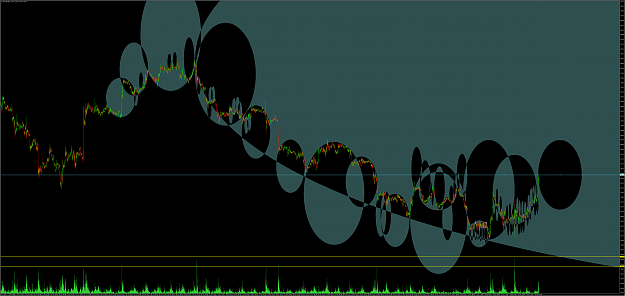
Sense of scale Make sure you check the time scales to see what I mean about hedge funds etc without stops. The first chart is with a view of the past few weeks... 15 Min picture. image and trhe next is a chart of the past few years. We are engulfed ...
XAU/USD & XAG/USD - Gold & Silver Traders Thread
- The Rhodie replied Dec 17, 2013
You might get a little more of that. This is the picture so far of the size of visible trades. Bear in mind that the biggest one is almost invisible at this scale because it is so large. It appears as diagonal line cutting through everything on the ...
XAU/USD & XAG/USD - Gold & Silver Traders Thread
- The Rhodie replied Dec 12, 2013
hmmmmmmmmm..... what's this mean?
XAU/USD & XAG/USD - Gold & Silver Traders Thread
- The Rhodie replied Dec 11, 2013
I agree that you may be correct. My view on the market is dynamic and I do not hold any position for long or short if the market sentiment changes dramatically. As we are nearer to support than resistance, It would be prudent to go long for the day, ...
XAU/USD & XAG/USD - Gold & Silver Traders Thread
- The Rhodie replied Dec 11, 2013
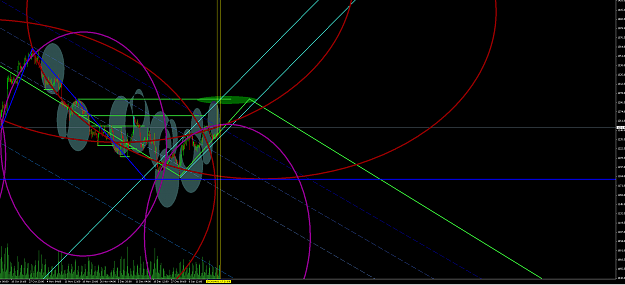
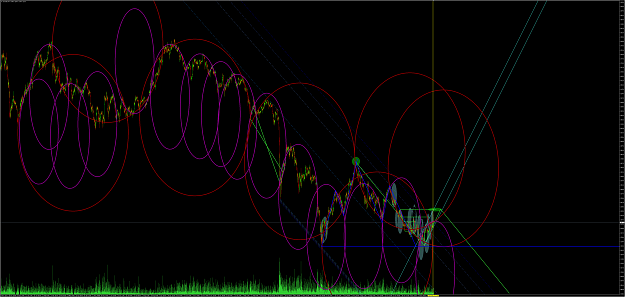
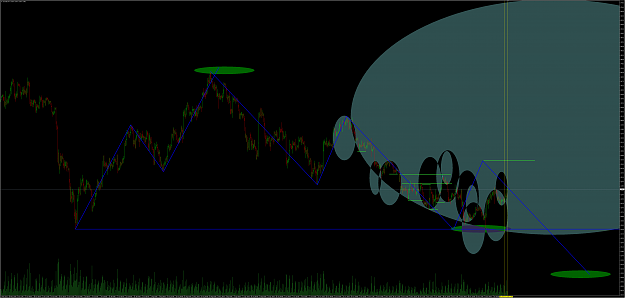
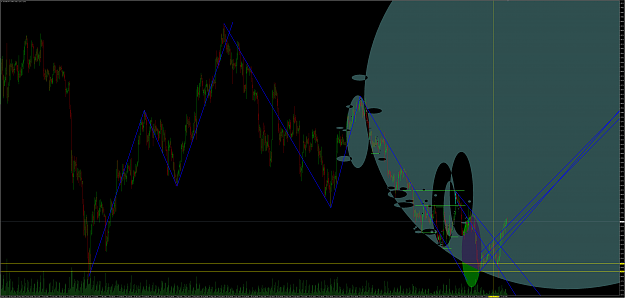
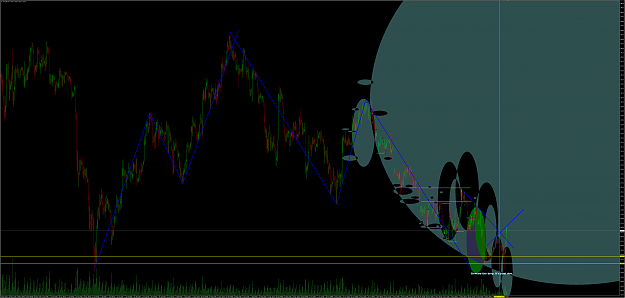
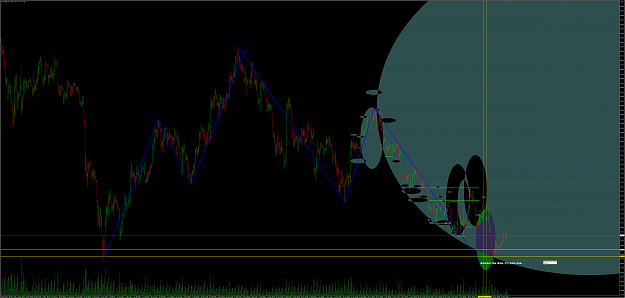
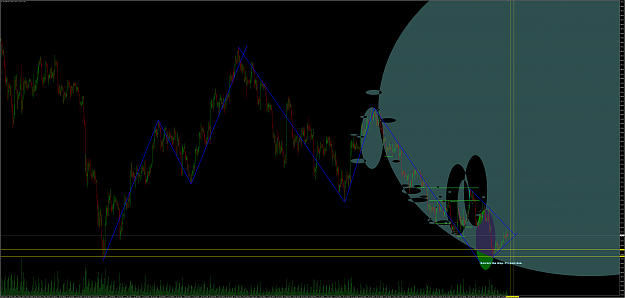
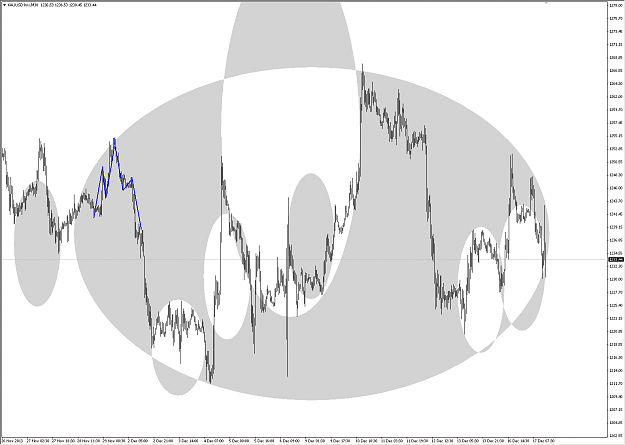
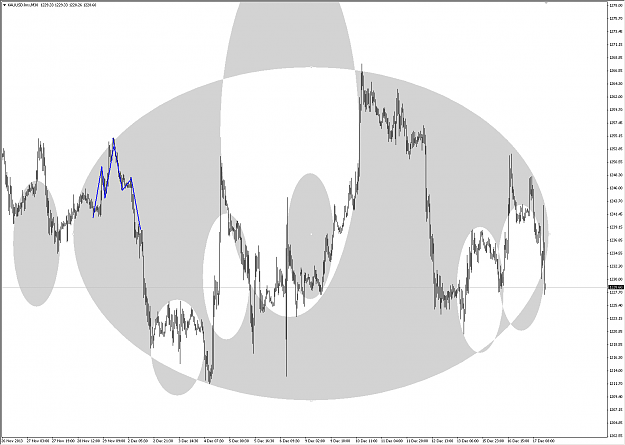
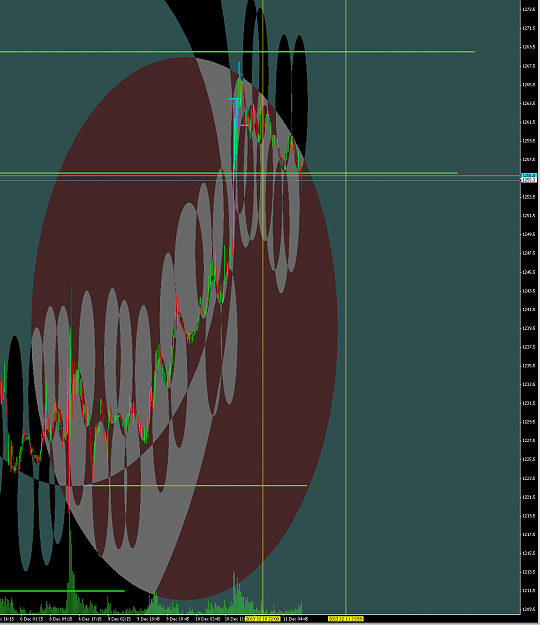
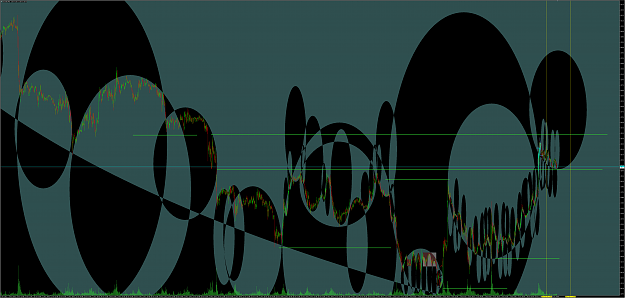
Is this the way that the market normally behaves? I have seen analysis models and trend systems, fibonacci levels and all sorts, but this seems to describe the markets really well. tThe larger ellipse is only a guess. I don't believe it until the ...
XAU/USD & XAG/USD - Gold & Silver Traders Thread
- The Rhodie replied Dec 11, 2013
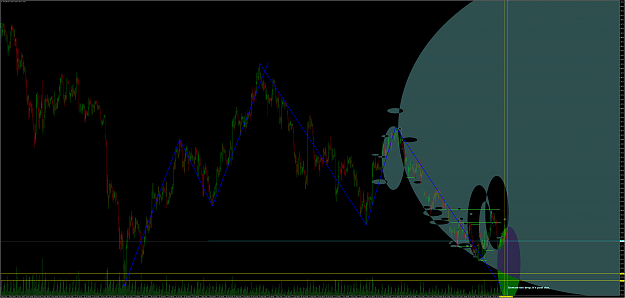
Daily analysis for Gold: Short the mother out of it. It cannot rally. If it cannot sell off, we must find out why... image Compare this with earlier posted image... image
XAU/USD & XAG/USD - Gold & Silver Traders Thread
- The Rhodie replied Dec 10, 2013
$37.62 because spread dropped to $0.28 Some more analysis patterns: image image
XAU/USD & XAG/USD - Gold & Silver Traders Thread

- The Rhodie replied Dec 10, 2013
No bias against gold miners, just the manipulation of the market. 5 banks control the planet's gold price. Is this the new direction? image
XAU/USD & XAG/USD - Gold & Silver Traders Thread
- The Rhodie replied Dec 10, 2013
To illustrate the idea in more detail, there are trades according to scale. Big corporates will not trade with more than a certain amount of their portfolio (about 5% max) which is why there are so many the same size. any profit they make goes into ...
XAU/USD & XAG/USD - Gold & Silver Traders Thread