- Search Crypto Craft
- 6 Results
-
 Spik replied May 20, 2014
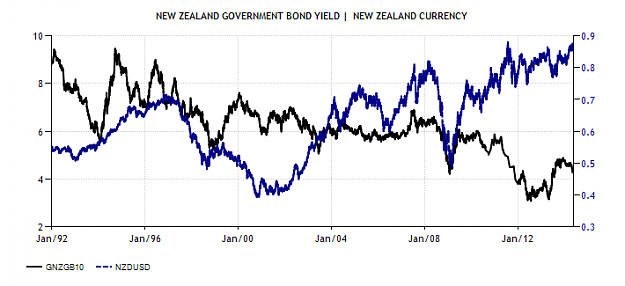
I see your point though i would like to mention that positive correlation between 10Y NZbond and NZDUSD is rather weak, if there is any at all. Below is chart for last 23 years to compare both. image
NZD/USD
- Spik replied Jul 29, 2012
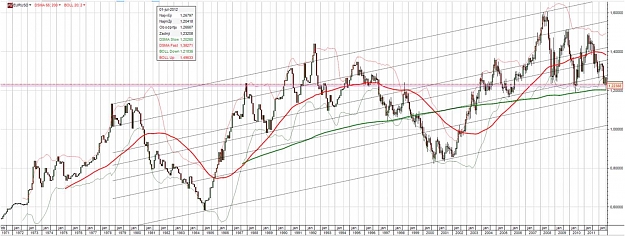
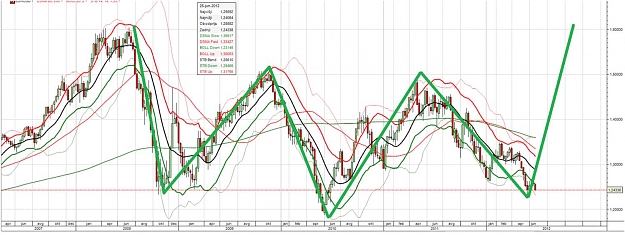
To answer pjotter's question. There is a chart EURUSD 1971-2012, monthly. Interesting part is rebounding from 200 MA (bold green). In 1997 (sharp) and 1999 (mild and temporary) and now in 2010 (sharp) and 2012 (? - mild and temporary?).
EURUSD
- Spik replied Jul 4, 2012
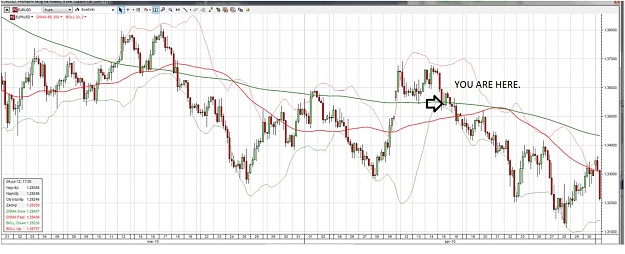
EURUSD setup; seen that before — We have been in that situation before. Charts say it all. After short pull over 200 DSMA on 4H chart we are bound to larger south move.
EURUSD
- Spik replied Jun 28, 2012
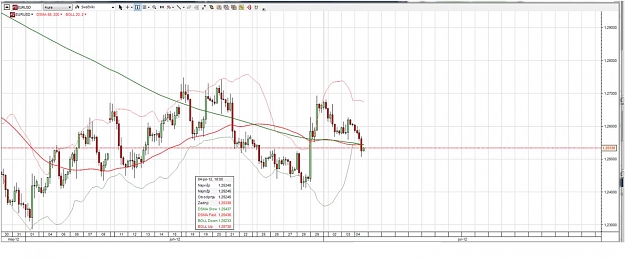
Just maybe? — Ok, I know: - i am a rookie that has no clue, - everyone says USD is in long-term bull state, - EUR is virtually not alive anymore, - USD/EUR is in long-term downtrend, - ... but looking at EURUSD 1-week graph it stroke me, that ...
EURUSD
- Spik replied Jun 3, 2011
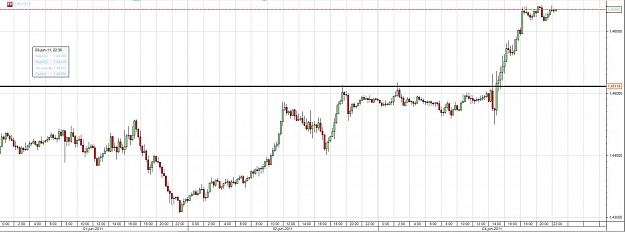
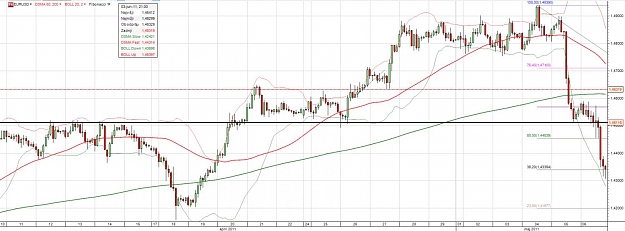
Current setup is strikingly similar to april-may 2011. 1st chart: Current setup in the last 3 days on 15 min 2nd chart: Setup in april-may 2011 Similarities: - first indecided teritory - then mighty fall to support line - swift recovery and higher ...
EURUSD
- Spik replied Mar 22, 2011
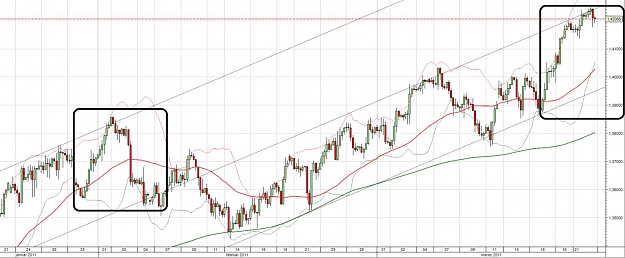
Current setup reminds me of February 2nd ... on 4h graph there was an exhausting climb to 1.385 (now 1.425), then slight slip to 1.38 (now to 1.42), then a narrow channel lasting 1 day at that price, and then fall to 1.363 (now 1.403? - tomorrow in ...
EURUSD
- Posts by Member Search: 'Spik'