- Search Crypto Craft
- 35 Results
-
 Sith Lord replied Feb 21, 2008
Attached is the 5M scalp result.... took 3 hours to move 25 pips ! Anyway got to bank in +20. This has to rank as the ugliest scalp on my record. Anyway I held on to the scalp as my QQE1 (green) and QQE5 (pink) were both crossed down...they never ...
GBP/JPY for QQE Traders!

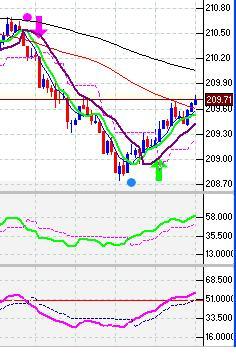
- Sith Lord replied Feb 21, 2008
5M scalper — Let's test whether this 5M scalper works live. There was a short trigger at 211.70. Tough trade going against the massive bull run. But a scalp is a scalp is a scalp.
GBP/JPY for QQE Traders!

- Sith Lord replied Feb 19, 2008
Hi Damo12 ...the attached 5M chart should help out. I've labelled the indicators on the right. I've been testing some stuff with Nobitacu on the side (Nobi is doing demo trades for me to test out my scalp twins strategy which includes 15M & 5M..so ...
GBP/JPY for QQE Traders!

- Sith Lord replied Feb 19, 2008
5M chart update — Updated 5M chart - aggressive trades can be taken with just a dot (QQE cross). I've just scalped 60 pips long without sweating. But try with a dot and arrow first. The 2 things you need is a dot (QQE cross) and price to be ...
GBP/JPY for QQE Traders!
- Sith Lord replied Feb 19, 2008
5M charts — I have found in the last month that 5min charts are an excellent time frame to enter trades. If you follow Aus 15min strategy (using the stop reverse system for arrow trigger) it gets you in at a pretty good entry price. An arrow ...
GBP/JPY for QQE Traders!
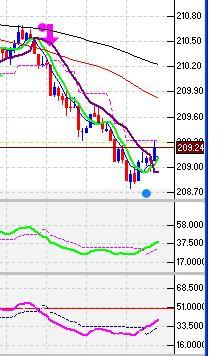
- Sith Lord replied Feb 13, 2008
Current price is 209.85 (hit an Asian session low of 209.35) Yesterday's high of 210.97 coincided with a bearish gartley 78.6 fib retracement (212.09 high/ 205.87 low). The bears have pushed price down to 38.2 area (209.37) without much bull ...
GBP/JPY for QQE Traders!

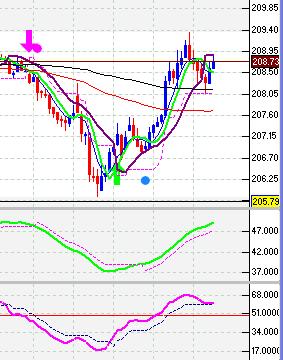
- Sith Lord replied Feb 7, 2008
Current price is 208.70 (US session high of 209.39) Exit signal: Ride the waves with the QQE5 on the 15M - enter and exit on the QQE5 crossing and when price moves above/below 5sma (green line). See attached chart. The QQE5 is a money making machine ...
GBP/JPY for QQE Traders!
- Sith Lord replied Feb 7, 2008
fx_lane ....keep it simple. Let your charts tell you what to do. I've attached my 15M chart. It is clearly bearish - to go long against 15M chart and QQE you need to be brave. Watch when QQE5 15M cross over to bullish - then enter long (if you have ...
GBP/JPY for QQE Traders!

- Sith Lord replied Feb 6, 2008
1H Charts — A real simple method to determine trend direction is on the 1H charts. I look at the Gann Hi Lo price (brown line) and 5sma close (green line). You can use the 15M if you prefer, however I like the 1H. As you can see from my chart ...
GBP/JPY for QQE Traders!

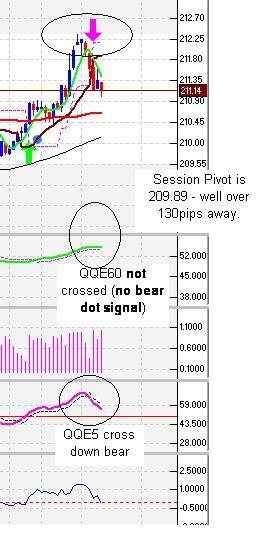
- Sith Lord replied Feb 4, 2008
15M charts update — QQE5 has crossed down (bears) but QQE60 is still crossed up (bulls) Need patience for all indicators to setup properly and trigger. We dont have any bear dots or bear arrow signals yet. So boring !!!!
GBP/JPY for QQE Traders!

- Sith Lord replied Feb 4, 2008
potential bearish gartely — Hey ultimate.....I've attached my 1H naked charts with fibs. It has hit the magical first 78.6 fib to the pip at 211.48. There is a sneaky second 78.6 fib at 211.60. You will also note 88.6 is very very strong ...
GBP/JPY for QQE Traders!

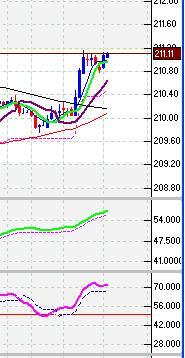
- Sith Lord replied Feb 4, 2008
Current price is 211.11 I think the 1H 100sma is very strong resistance. I see very strong resistance at 211.63 - 211.84. This coincides with a bearish gartley (meaning bears will resume control and bulls will weaken in this price zone). Watch out ...
GBP/JPY for QQE Traders!
- Sith Lord replied Jan 28, 2008
Naked charts — Current price is 211.17 Attached chart to ponder. Price is currently bearish. If bears continues the push down I see price going to the 78.6 Fib area of 208.00 - 208.60. If and when price moves into that 208.xx price zone look ...
GBP/JPY for QQE Traders!

- Sith Lord replied Jan 24, 2008
Hi Judith, today is the first day I am totally neutral on this currency. The reason is it broke the low in the US session by only 10 pips, which technically will constitute a downtrend continuation ("lower lows and lower highs"). What is baffling me ...
GBP/JPY for QQE Traders!

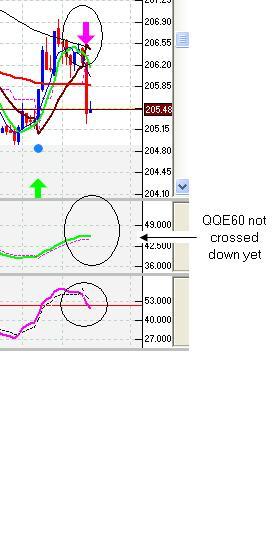
- Sith Lord replied Jan 21, 2008
15M Charts attached. QQE60 on 15M is still bullish - it has not crossed down yet and there is no dot signal for Aus 15M strategy entry. Current price is 205.57. Price dropped like a rock to 205.21 very quickly. If price does settle above 205.75 we ...
GBP/JPY for QQE Traders!
- Sith Lord replied Jan 21, 2008
1H Charts — Attached is a 1H chart. I have been "testing" some QQE settings on this TF and changed Aus' alert to "1" with stop loss 0.003 (this is the green QQE line). You will notice that even in our "ranging" in the past few trading days ...
GBP/JPY for QQE Traders!

- Sith Lord replied Jan 18, 2008
1H/4H Strategy update — Current Price is 210.70 at 6.25am London Time 1H/ 4H Strategy Update QQE5 4H = Bullish (crossed up). Bullish on GannHiLo 209.85 QQE5 1H = Bearish (crossed down and at 50%). Bullish on GannHiLo 209.88 4H Candle has ...
GBP/JPY for QQE Traders!

- Sith Lord replied Jan 17, 2008
15M Strategy update — Current price is 211.56 The bullish move has hit an intraday high of 212.40s. We have just seen more than a 100 pip drop. However the bullish move is not over - there are no bear signals to enter yet so you need to keep ...
GBP/JPY for QQE Traders!
- Sith Lord replied Jan 17, 2008
15M Strategy update entry — Patience would have paid off on the 15M. It took 2 hours for entry signals to setup - but it only took 10 minutes for the big move. Attached is the 15M chart. Bull Arrow Trigger (210.70) and QQE60 cross dot (210.90) ...
GBP/JPY for QQE Traders!

- Sith Lord replied Jan 17, 2008
15M Strategy Update - London opening up — Current Price is 210.77 at 6.27am London Time 15M Strategy Update: Mixed signals – trade with caution ! Price is Bearish on 100sma & daily 5sma & Bullish on daily pivot 1H 100sma = 211.12 Daily 5sma = ...
GBP/JPY for QQE Traders!
