- Search Crypto Craft
- 65 Results (2 Threads , 63 Replies )
-
 Shaggy_rock replied Jun 3, 2012
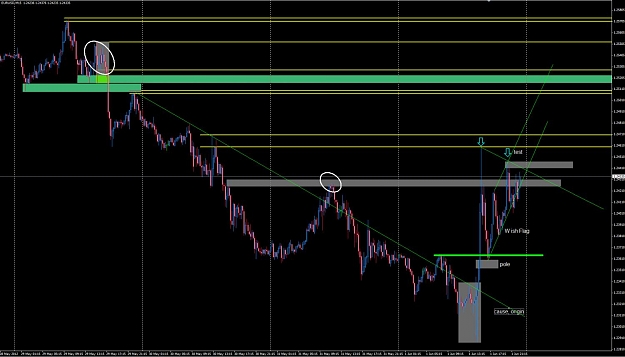
So you guys say this red box is compression? You must be joking, right ? I'm obviously in the wrong thread.
Price is Everything Chat Room
- Shaggy_rock replied Jun 2, 2012
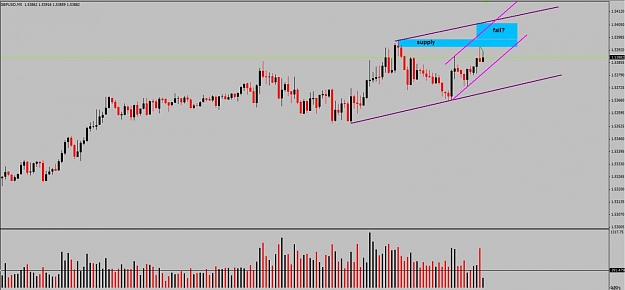
has nothing to do with compression, it's a big ass shakeout, might be retested a break out with good result, the spike pole is forming a w ish pattern as a flag, as this is a "reason" and market closed under those conditions, both directions are ...
Price is Everything Chat Room
- Shaggy_rock replied May 9, 2012
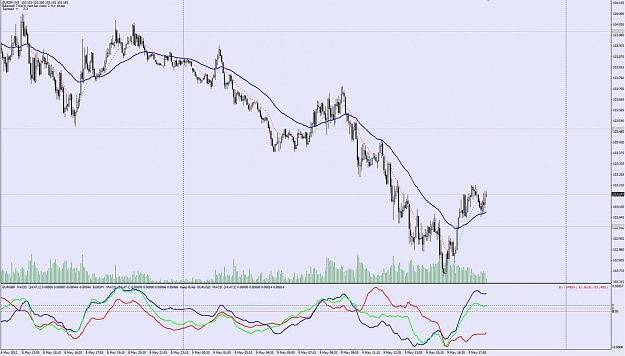
old topic but only just spotted it, as i was looking for a macd dashboard, but this might even be better, thank you, this is a wonderful tool hay ! i use macd sma set to one so i only have one line, only got to make different templates for euro/., ...
combining two pairs
- Shaggy_rock replied Feb 20, 2012
aussie looks interesting, looking for a weak downbar now to enter long, if not shortit!
vsa with Malcolm
- Shaggy_rock replied Feb 11, 2012
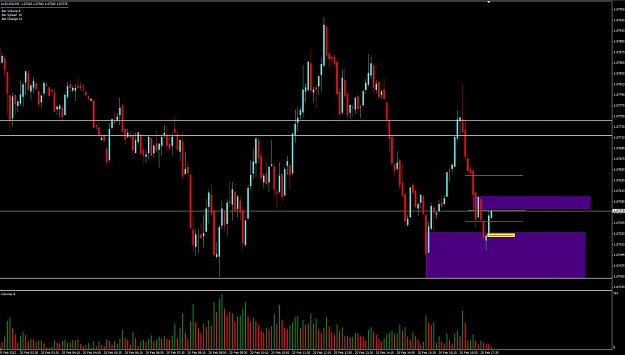
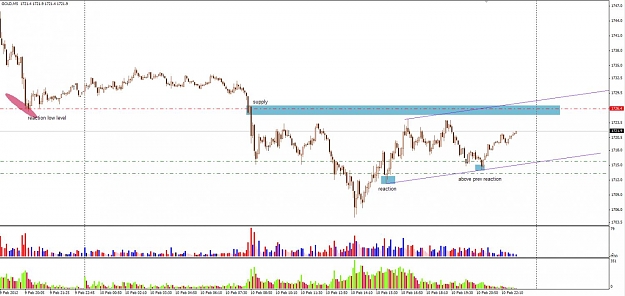
Some crucial levels 26 (reaction low) could flip gold back down, there are sellers that brought it further down from there. If going above 34 and staying there we are in another range (to top high) For now and until level 26, there should be only ...
XAU/USD & XAG/USD - Gold & Silver Traders Thread
- Shaggy_rock replied Jan 29, 2012
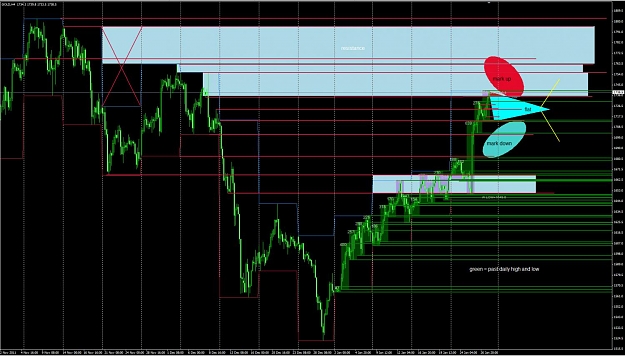
horizontal levels to watch and possible scenario
XAU/USD & XAG/USD - Gold & Silver Traders Thread
- Shaggy_rock replied Jan 29, 2012
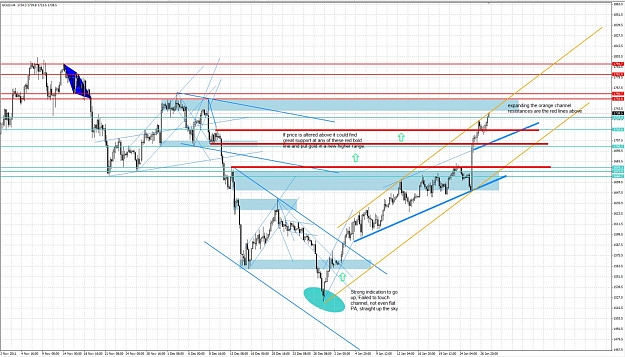
how I see gold, I think the orange channel is about to expand, but could already find resistance in the blue box, maybe taking a little breath and retrace to break it and testing those red lines above. Let's see what goes first. Cheers S.
XAU/USD & XAG/USD - Gold & Silver Traders Thread
- Shaggy_rock replied Jan 29, 2012
Hi David I am looking for something like this but instead of the text object for the price, would it be possible to add a trendline extended into the future? (ray???) so it would look like this It would save a lot of time
Drawing isosceles triangle in MT4
- Shaggy_rock replied Jan 20, 2012
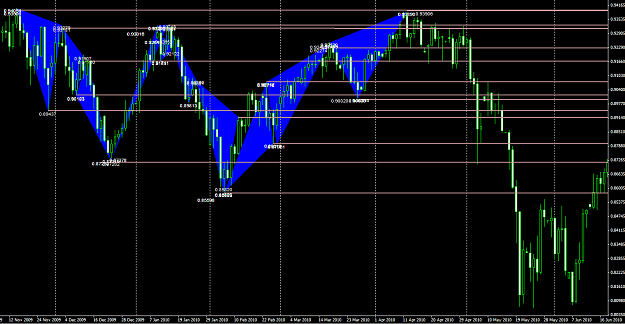
I only just saw this, since I nolonger really use fibonacci in my trading. Talking of a confluence zone ! As I said in my last post here, exit all longs, enter one mini short already with tight MM so okay.. .. Cheers..
Cable Update (GBPUSD)
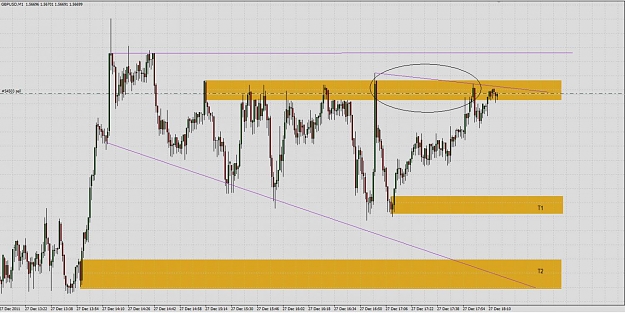
- Shaggy_rock replied Jan 17, 2012
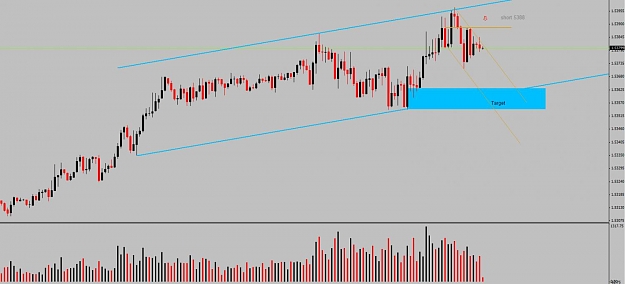
agressive entry at 90. no real target expect break of violet trendline. stops above 5400
Cable Update (GBPUSD)
- Shaggy_rock replied Jan 17, 2012
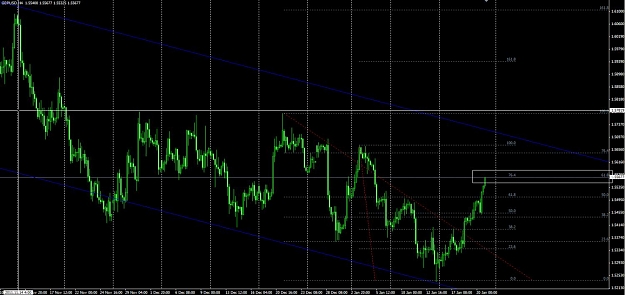
short since 5388, target on tl's & demand flat pa actually can still go against.
Cable Update (GBPUSD)
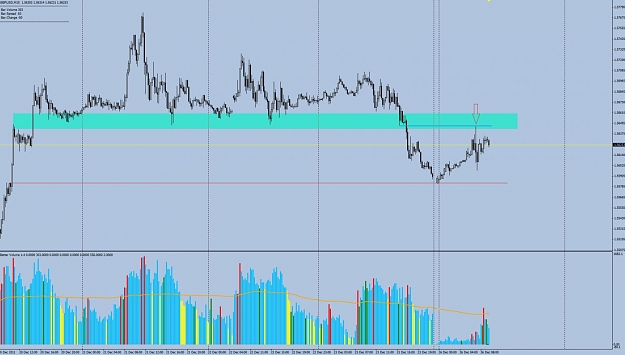
- Shaggy_rock replied Dec 27, 2011
tryin a carefull short on GU, not too sure if supply is still there..
Price is everything
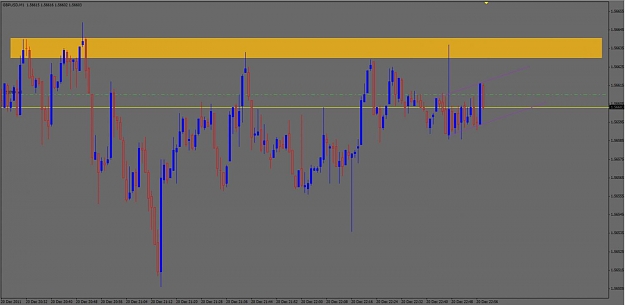
- Shaggy_rock replied Dec 26, 2011
Had no intention to trade today, but my sell got triggered... 5645.
Cable Update (GBPUSD)
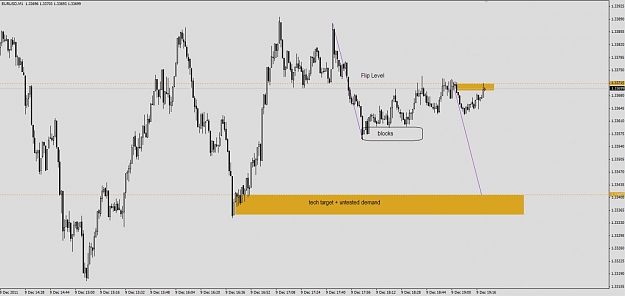
- Shaggy_rock replied Dec 20, 2011
short on cable. 1M scalp, but i'd like a 4O ish drop into consolidation below. would make sence. will see.
Price is everything
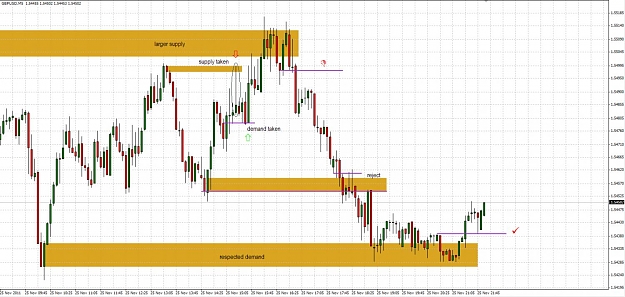
- Shaggy_rock replied Nov 26, 2011
Hi and nice charts, not familiar with ww. too bad the trade went against you, as long as you know the reasons why it did, that's how we learn. I think this should be correct. Good luck with yer trades. S.
Price is Everything Chat Room
- Shaggy_rock replied Nov 24, 2011
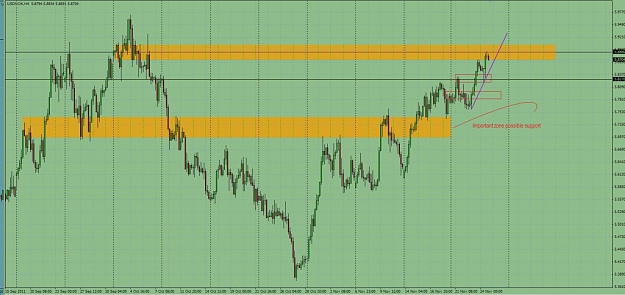
Eyeballin USD/NOK. Possible long term opportunity, that's why i'm posting it here and not it red's thread. I don't trade this pair very often but i'm following it closely since two weeks now, it's looking nice. any comments are welcome. My levels ...
Price is Everything Chat Room
- Shaggy_rock replied Nov 20, 2011
Hi, I've got a question about the nzd/usd chart. Logically we would follow the higher timeframes, which in this case would make the demand level on the daily chart invalid? Since it already broke with a lower close on the weekly. Could we see this ...
Price is Everything Chat Room

- Shaggy_rock replied Nov 19, 2011
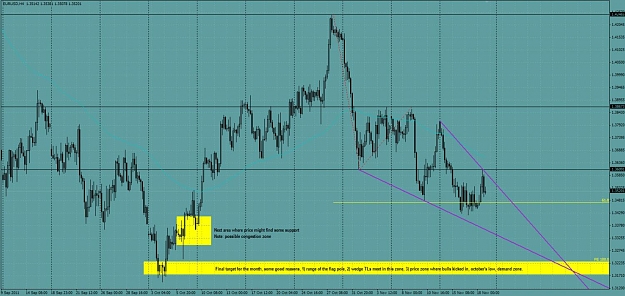
My weekly EU outlook, everything is on the chart, have a look. Cheers S.
EurAnalysis
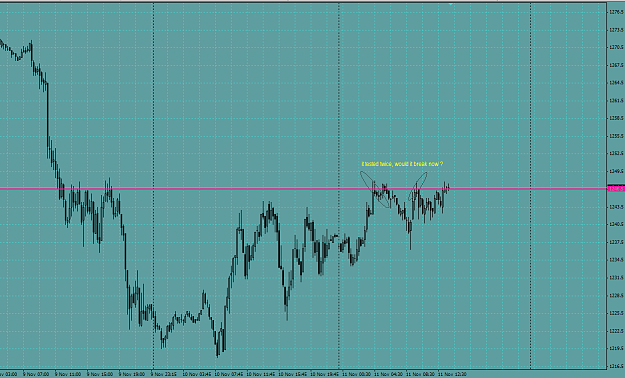
- Shaggy_rock replied Nov 11, 2011
s&p, i believe i've read a third test could break the zone? what would be your opinion ?
Price is everything