- Search Crypto Craft
- 77 Results (1 Thread , 76 Replies )
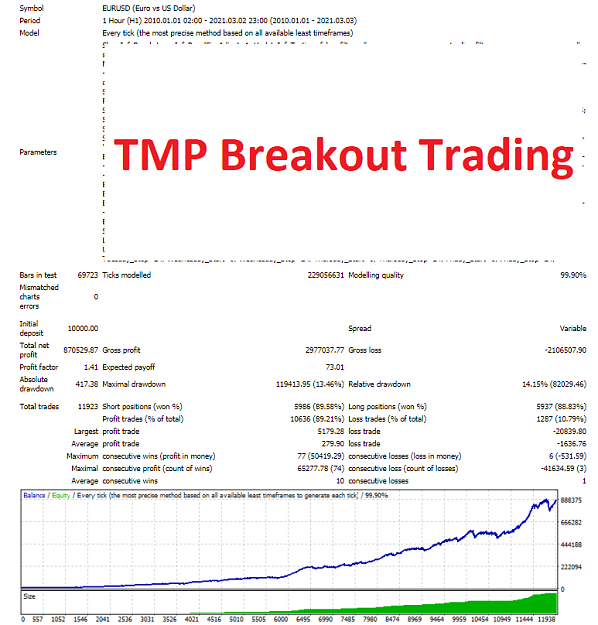
- TMP Breakout TradingStarted Mar 6, 2021|Commercial Content|2 replies

Welcome to my trading journal thread. This thread is dedicated by myself to share my currently ...
-
 Sants replied Jan 20, 2016
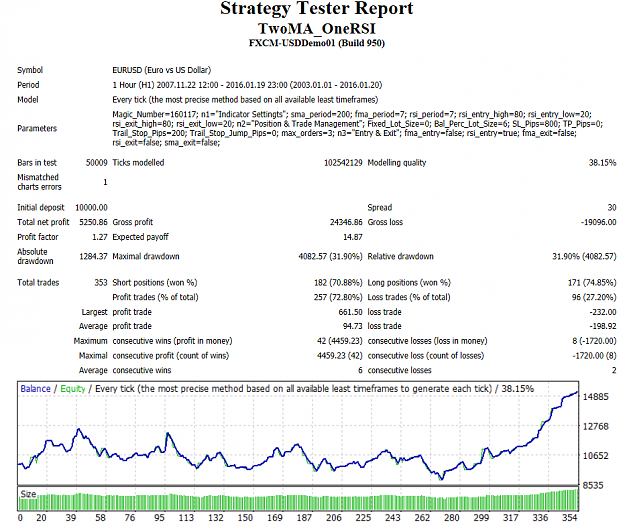
thumbs up!! yes i forgot FXCM provide lower leverage, thanks its clear for the differ result. Shall we proceed to discuss a far long term (2007 and lower) backtesting result
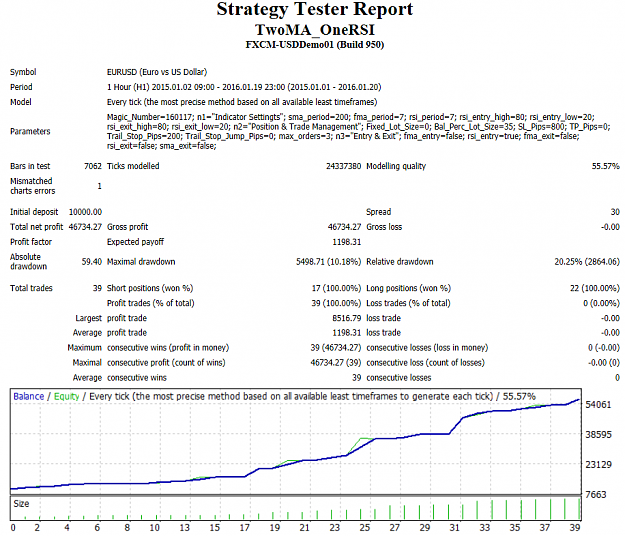
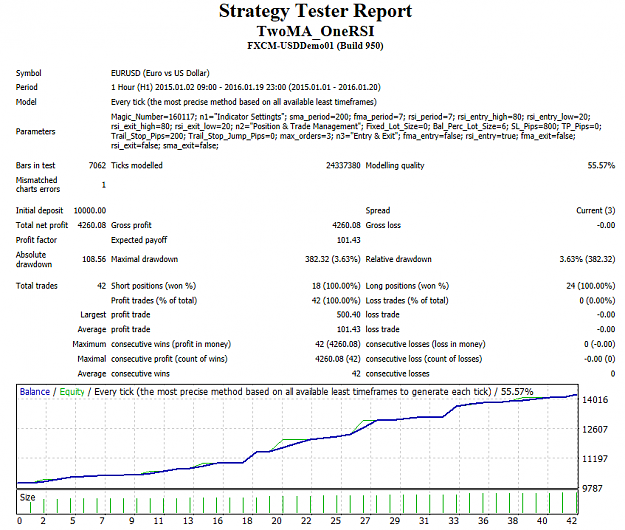
A Proven Simple Strategy (2MAs, 1 RSI)
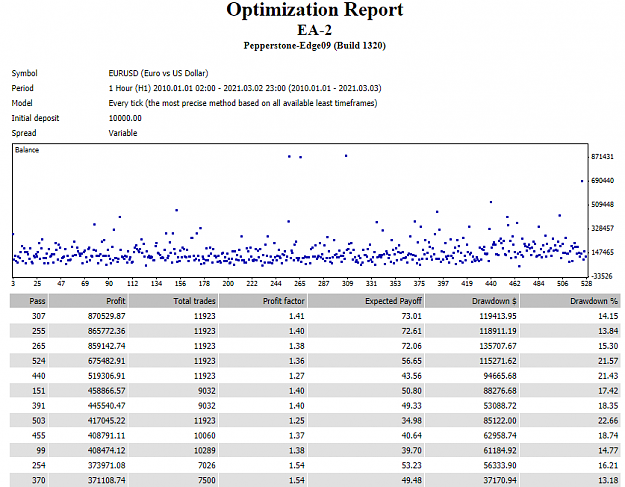
- Sants replied Jan 20, 2016
As far as i know, modelling quality is just a matter of each broker pricing model and it wont affect the whole tested strategy, isnt it? <-- not quite sure please correct me if im wrong. I just download the history data from my own broker history ...
A Proven Simple Strategy (2MAs, 1 RSI)
- Sants replied Jan 20, 2016
I dont know why but how i get different result from abokwaik with the same setting :| EDITED: wrong image, fixed
A Proven Simple Strategy (2MAs, 1 RSI)
- Sants replied Oct 26, 2015
Hi Alfonso Thanks for clearing the curve rules. Beside those rules, is there anything else? About the "wait for brand new level" in a confirmation trade, both of them are USDCHF H4 (entry timeframe) within D1 SZ (lets assume the D1 supply zone is ...
Supply and demand in a nutshell by Alfonso Moreno
- Sants replied Oct 15, 2015
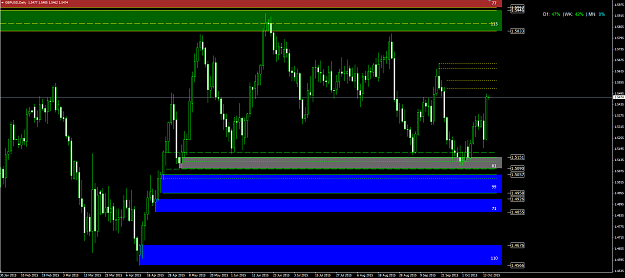
Hi Alfonso Im there's an indicator for showing the how high/low in the curve at right top like you did. am i doing it right within those zone? My consideration is your rules for curves is supply and demand zone in control. The supply zone which is ...
Supply and demand in a nutshell by Alfonso Moreno
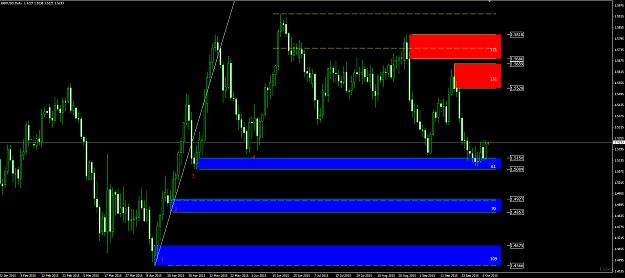
- Sants replied Oct 9, 2015
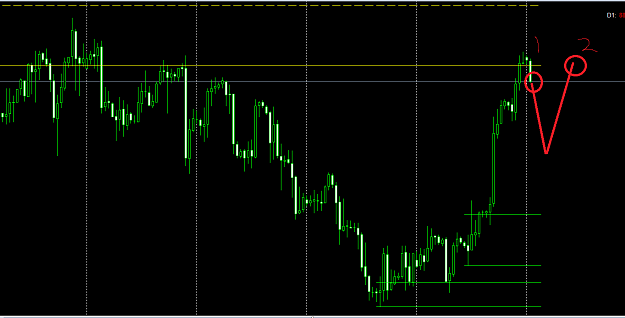
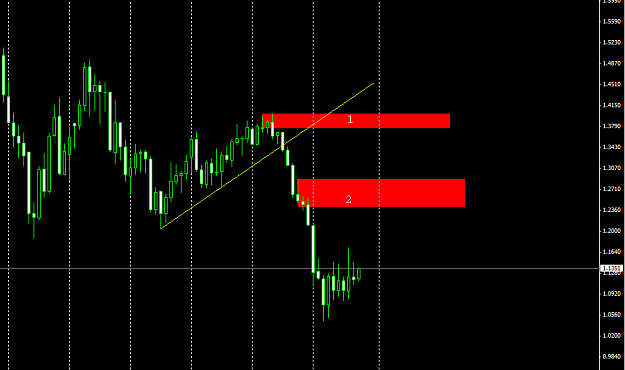
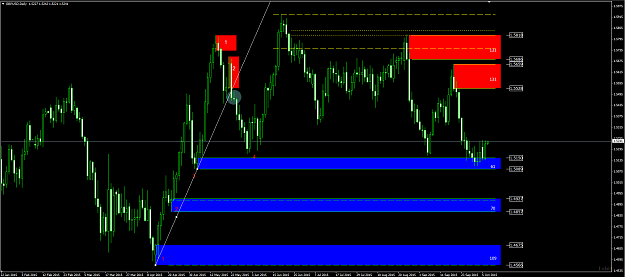
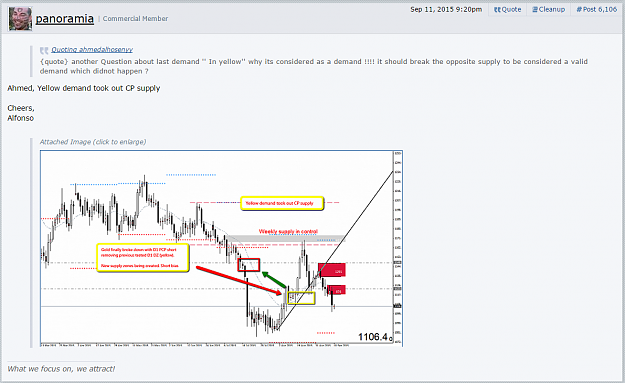
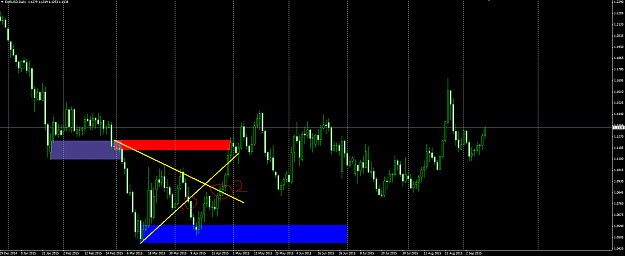
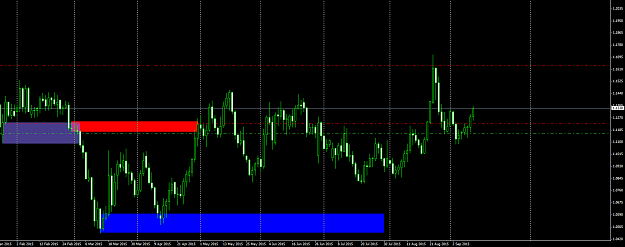
hi alfonso by the attached image, the red supply zone number 1 is valid after the broke of ascending trendline. is the supply zone number 2 is valid too? or its just a "potential CP pattern zone"? Sants
Supply and demand in a nutshell by Alfonso Moreno
- Sants replied Oct 6, 2015
Another question that quite unclear Alfonso
Supply and demand in a nutshell by Alfonso Moreno sorry too much asking 1. why you draw your D1 Gold demand zone as pic1 instead of pic no2? i mean, the basing candle of DBR counted as the 1 candle left side from the LEG up and see is the high and the ...
- Sants replied Oct 6, 2015
hi alfonso heres ill make some things clear
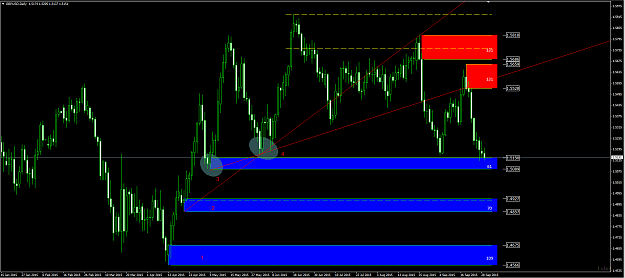
Supply and demand in a nutshell by Alfonso Moreno 1. at first, looks like the valley number 1 connecting the valley number 2 cant be called as a trendline due to 'valley number 2' is more looks like a CP pattern eventough both of zone are nested inside ...

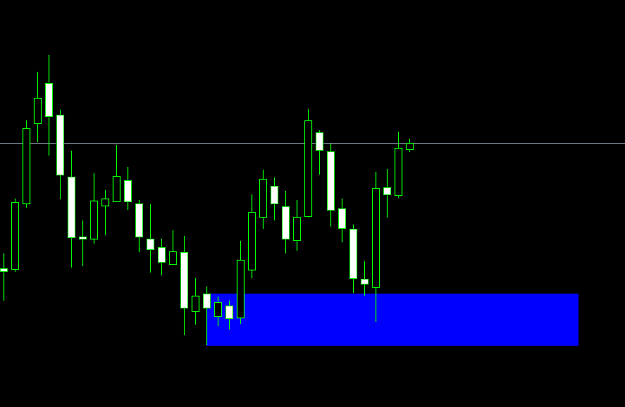
- Sants replied Sep 29, 2015
ehmm by the image uploaded, im using your indi the 'rectangle reader' i have drawed the weekly levels as shown in default settings....and yeah, demand zone number 1 and number 2 is nested within the weekly demand zone as weekly zone shown. i mean ...
Supply and demand in a nutshell by Alfonso Moreno
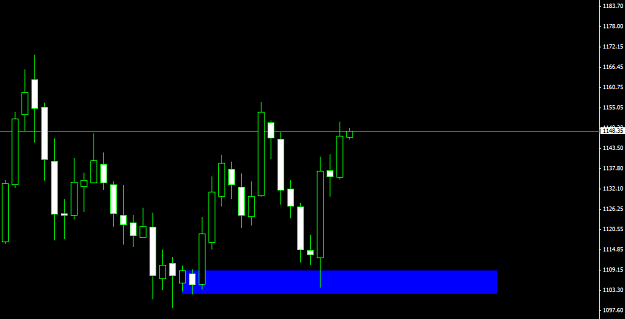
- Sants replied Sep 28, 2015
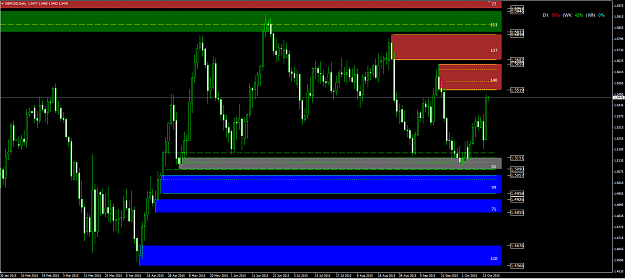
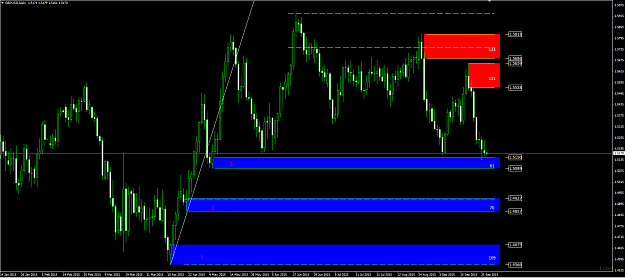
Hi alfonso Here's the chart i mean. below is GBPUSD in Daily chart. May you correct me if im wrong
Supply and demand in a nutshell by Alfonso Moreno (1) The trendline connecting valley1 and valley2 is valid right? and its broke after there's a candle that has OHLC below the trendline. (Valley1 ...

- Sants replied Sep 27, 2015
hi alfonso Regarding my previous post and a question that i cant find the answer by the videos or even the rules: Aside from trendline broke for confirm a zone, is a zone valid as a zone if it is violating the opposing zone/violating the valid ...
Supply and demand in a nutshell by Alfonso Moreno
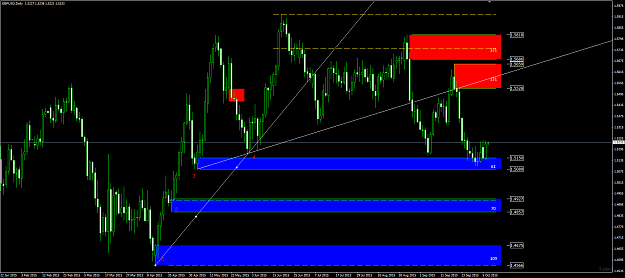
- Sants replied Sep 13, 2015
So let me zoom it for trendlines conditions. got lot of questions to ask 1. is the valley (demand zone) for creating the ascending trendline is valid? when is valid and why? when isnot valid and why? 2. if the valley that form the ascending ...
Supply and demand in a nutshell by Alfonso Moreno
- Sants replied Sep 12, 2015
Hi Alfonso, I want to ask the thing which really puzzled me and actually i got the extreme solution for my own question, but thats really tough and im looking for correct answer before i proceed to my own solution
Supply and demand in a nutshell by Alfonso Moreno Is a supply/demand level will be ...
- Sants replied May 17, 2015
If EURUSD starts the retrace from here and if it is really want to the upside more, it needs to fill the order at least at 1.1000 to further station at 1.17+ Bullish 5-0 almost completed
EURUSD
- Sants replied Apr 23, 2015
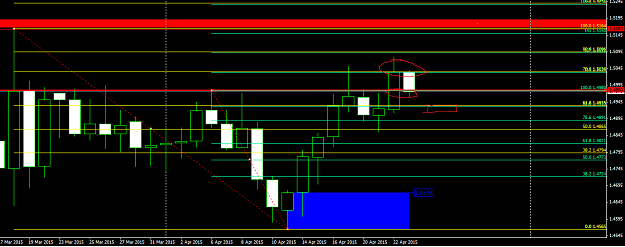
Yes this is Daily charts, that's a total rejection at 113 and 78.6 confluence at 1.5034 by today candle, so it went down but its still normal due to establshment of demand zone starts at 1.4674 days ago which is targeting daily supply zone at 1.5163 ...
EURUSD
- Sants replied Apr 23, 2015
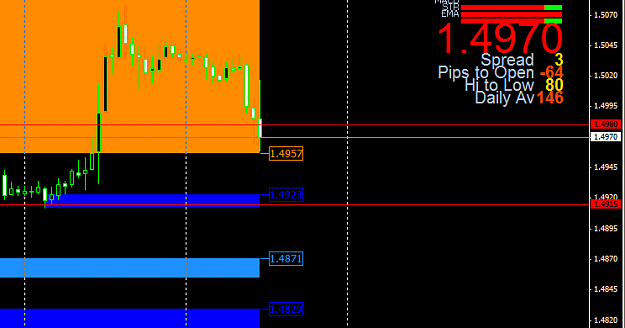
it will be a trouble for short if this hour close above 1.4980, but seems like its not gonna happen within -0.5% vs 0.4% Target at 1.4923, 1.4871, and 1.483 isnt it will be a another trouble if price bounces at 1.4923 that confluence with 4H key R ...
EURUSD
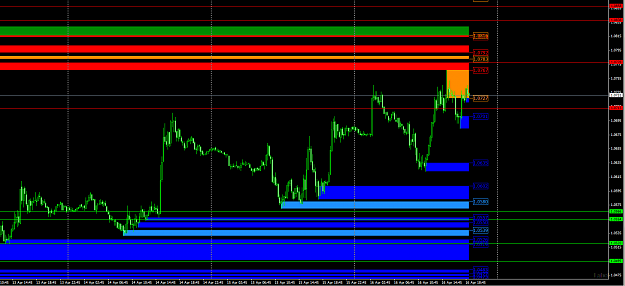
- Sants replied Apr 23, 2015
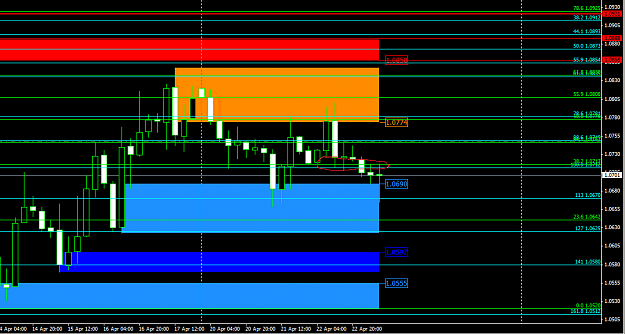
awts i didnt recognize the mini S turns R at 1.0717. By visiting the 1.0665, isnt EU gathering pathetic bull strength to at least break the mini R? coz hourly really really sucks to the top at key level
EURUSD
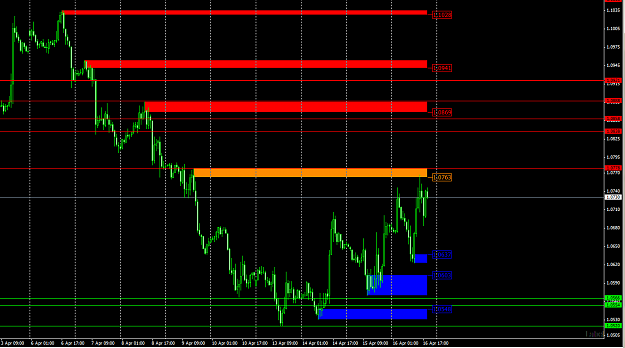
- Sants replied Apr 23, 2015
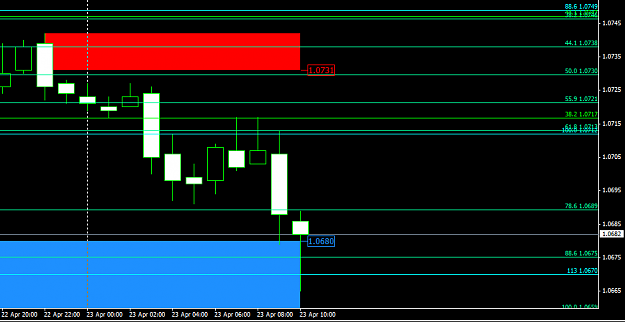
I dont like what i see, but seems its quite make sense despite of QE 60B is a total failure by French and Germany latest data. EU visit the demand zone 1.0665 and H1 candle rejects the .886 fibs at 1.0675 and 1.13 larger fibs at 1.0670. Triple ...
EURUSD
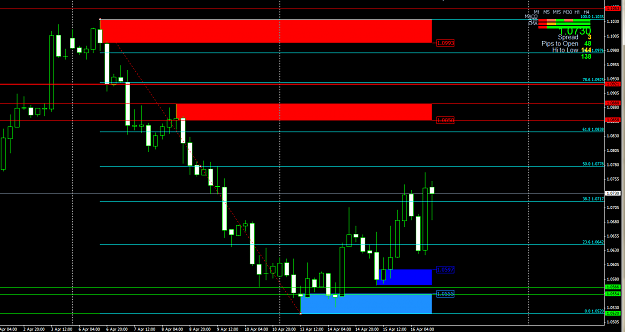
- Sants replied Apr 16, 2015
EURUSD -Daily Chart is showing establishment of short term bullish sign by rejection on Tuesday at 1.0562, leaving the demand zone to approach the 1.0921 -H4 Chart is showing the same thing by short term demand zone starts at 1.0555 to hit possible ...
EURUSD