- Search Crypto Craft
- 174 Results (1 Thread , 173 Replies )
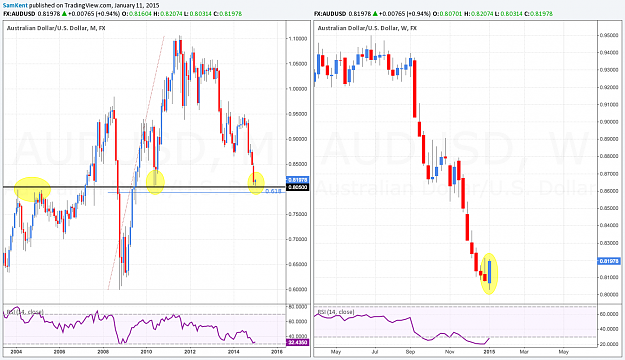
- SamKent replied Jan 11, 2015
AUD/USD: Weekly Discussion for the Week of Jan.12-16th the AUD/USD has been trading this week at a key historical level. If we take a look at the monthly chart, we can see that the 0.800 level has served several times as a key support/resistance ...
Investing Academy Trading&Money Management Courses
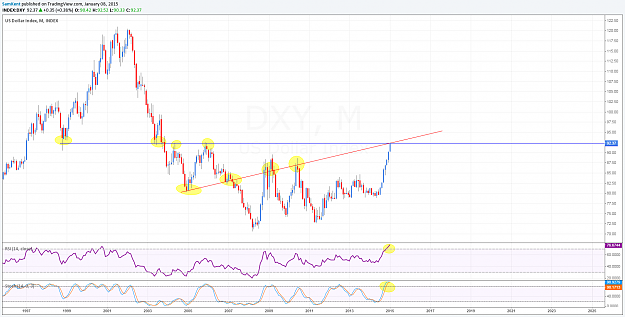
- SamKent replied Jan 8, 2015
DOLLAR INDEX LONG-TERM ANALYSIS Not too much to say here, we're basically looking at massive momentum running into significant resistance, make sure to be well aware of this long-term collision and make sure to be positioned accordingly.
Investing Academy Trading&Money Management Courses
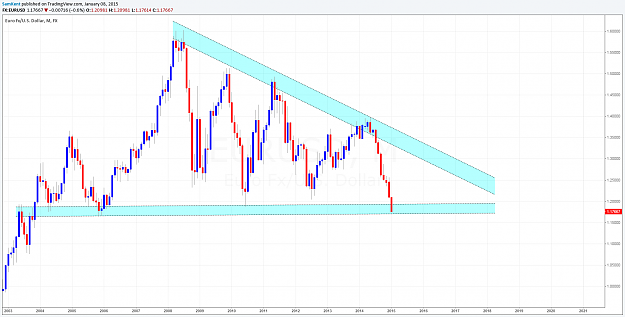
- SamKent replied Jan 8, 2015
EUR/USD LONG-TERM DESCENDING TRIANGLE We're looking at the EUR/USD monthly chart. We can clearly see how highly impulsive these latest few down months have been. However, the pair is currently hitting the base of the long term descending triangle. ...
Investing Academy Trading&Money Management Courses
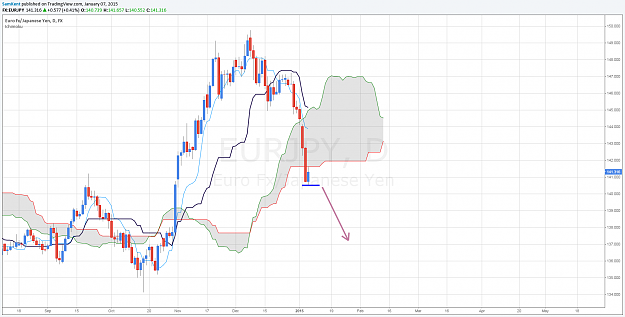
- SamKent replied Jan 7, 2015
EUR/JPY KUMO BREAKOUT The EUR/JPY daily chart has broken down a thick kumo support on the back of a highly impulsive bearish wave. Currently, the pair has retested the flat kumo bottom, and is trading bullish for the day. We're looking for an entry ...
Investing Academy Trading&Money Management Courses
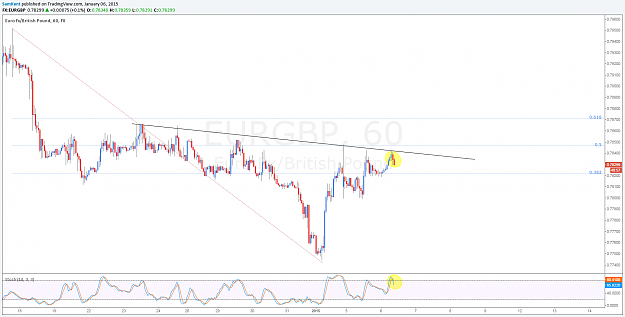
- SamKent replied Jan 6, 2015
EUR/GBP SHORT OPPORTUNITY The EUR/GBP has been having some significant volatility as of late. Currently, the 1H chart is trading at the trend resistance line. We've also got a nice confluence between candlestick action at resistance and stochastic ...
Investing Academy Trading&Money Management Courses
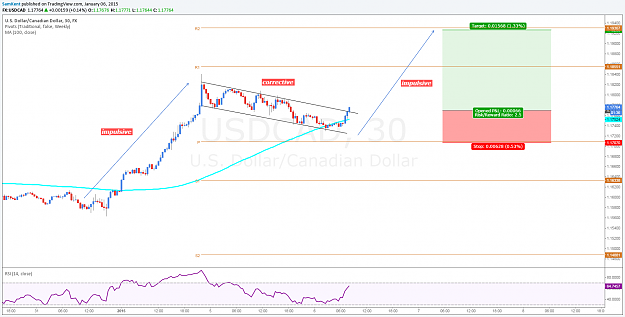
- SamKent replied Jan 6, 2015
USD/CAD Breakout Trade The USD/CAD 30M chart looks to have broken the sideways corrective movement to the upside. This on the back of the 100 SMA and a bullish RSI reading. We're interested buyers, with an impulsive-corrective-impulsive sequence as ...
Investing Academy Trading&Money Management Courses
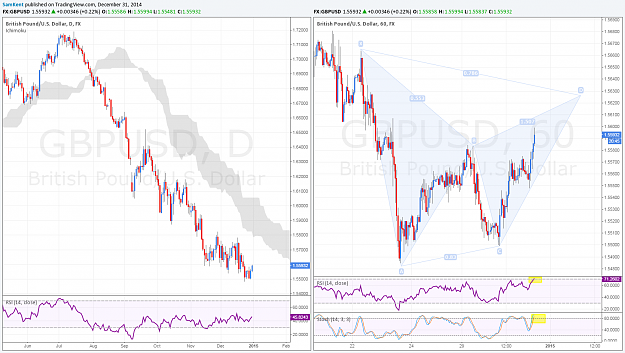
- SamKent replied Dec 31, 2014
GBP/USD LOOKING FOR SHORT The GBP/USD is moving higher, we may be looking at a possible XABCD bearish pattern in the making. Adding to that possibility, the pair is overbought on both oscillators on the hourly chart. Additionally, if we look at the ...
Investing Academy Trading&Money Management Courses
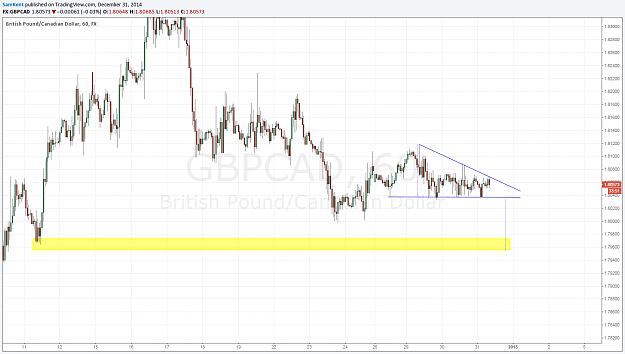
- SamKent replied Dec 31, 2014
GBP/CAD PATTERN TRADE The GBP/CAD 1H chart is in a descending triangle formation. A break of the base line is projected to send us back to the historic support level at around the 1.79600 handle.
Investing Academy Trading&Money Management Courses
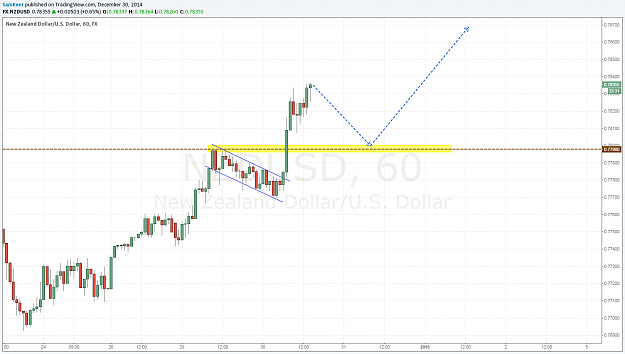
- SamKent replied Dec 30, 2014
NZD/USD BUYING ZONE The NZD/USD is in the midst of another impulsive move to the upside, after breaking through the recent flag formation. Currently, we're looking for a pullback back to the 0.77980 area, at which point we'd be NZD buyers.
Investing Academy Trading&Money Management Courses
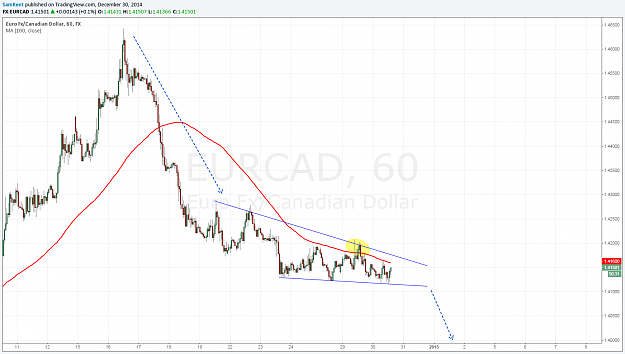
- SamKent replied Dec 30, 2014
EUR/CAD BEARISH OUTLOOK AND PATTERN The EUR/CAD is trading sideways in a descending wedge formation. We're bearish on the pair, with the latest impulsive move being to the downside, coupled with the 100 SMA serving as resistance, after a recent ...
Investing Academy Trading&Money Management Courses
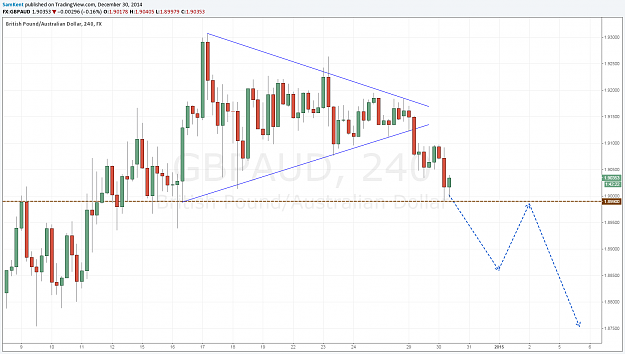
- SamKent replied Dec 30, 2014
GBP/AUD BREAKING LOWER The GBP/AUD has broken down from a wedge pattern which formed on the 4H chart. We're currently bearish on the pair, and looking for a break of the 1.89900 support, which will then become our short entry level as a ...
Investing Academy Trading&Money Management Courses
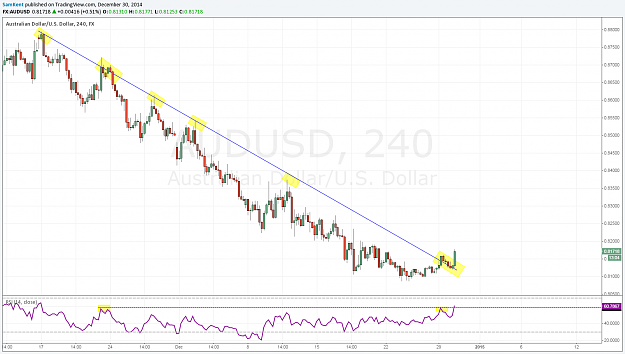
- SamKent replied Dec 30, 2014
AUD/USD TREND REVERSAL The AUD/USD 4H chart seems to be ripe for a shift in trending momentum. The pair has broken the descending trend-line to the upside, has formed a massive breakout buying candle, and has broken RSI resistance at around the 60 ...
Investing Academy Trading&Money Management Courses
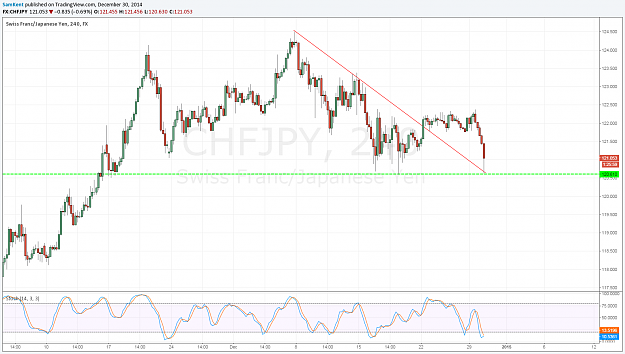
- SamKent replied Dec 30, 2014
BUYING OPPORTUNITY ON THE CHF/JPY The CHF/JPY 4H chart is trading at horizontal support (120.610), as well as at support from a previously broken descending trend-line. This coupled with an oversold stochastic reading, in an otherwise neutral market ...
Investing Academy Trading&Money Management Courses
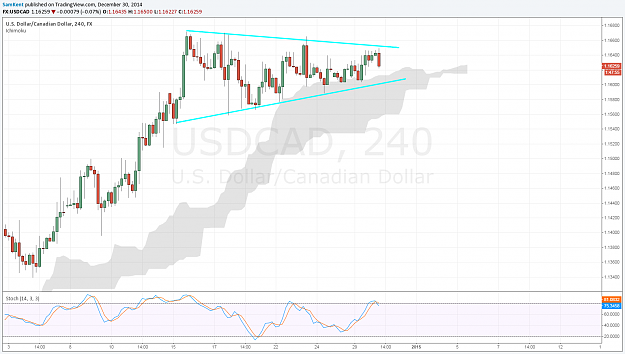
- SamKent replied Dec 30, 2014
USD/CAD 2 Way Pattern The USD/CAD 4H chart is trading inside a wedge formation. In terms of the overall market structure, we're still in a bull market, with the ascending trend-line coinciding and serving as support alongside the kumo cloud. ...
Investing Academy Trading&Money Management Courses
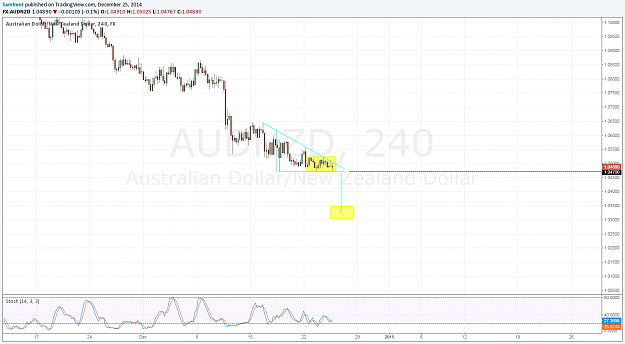
- SamKent replied Dec 25, 2014
AUD/NZD 4H: Pattern Breakout The AUD/NZD is in a well defined bear trend, and we're looking for the downside breakout of recent consolidation, and the descending triangle formation. A break lower should ultimately send us towards the 1.3500-1.0300 ...
Investing Academy Trading&Money Management Courses
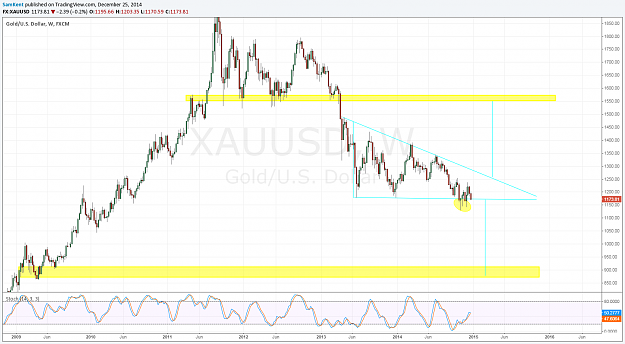
- SamKent replied Dec 25, 2014
GOLD: LONG TERM OUTLOOK AND PROJECTIONS Looking at the Weekly chart of Gold, we can see a descending triangle formation, the base of the pattern has been broken only to reverse back, and now we're getting another breakdown. This is a key moment for ...
Investing Academy Trading&Money Management Courses
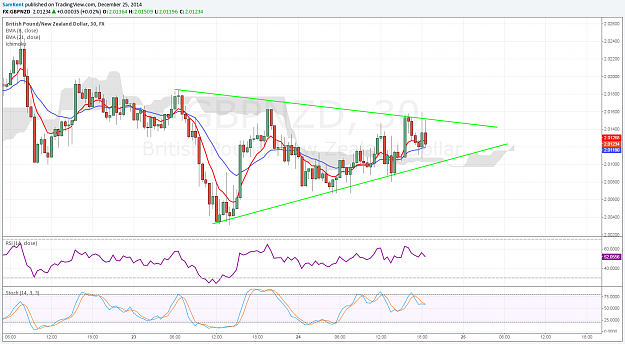
- SamKent replied Dec 25, 2014
GBP/NZD 30M BULLISH OUTLOOK The GBP/NZD is trading at a point of equilibrium with a slight directional bias to the upside. The pair is using the kumo as support, as well as the 21 and 8 EMA's, and in addition is holding above 50 readings on the ...
Investing Academy Trading&Money Management Courses
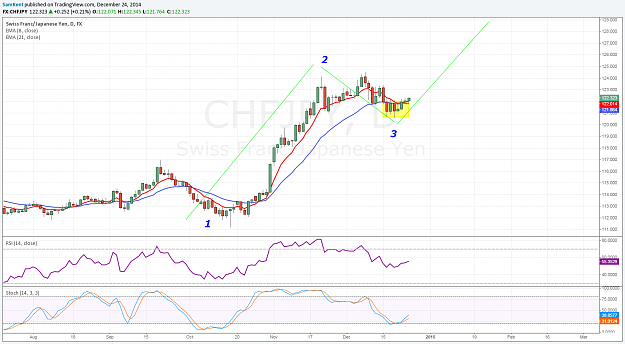
- SamKent replied Dec 24, 2014
CHF/JPY BULLISH POTENTIAL The CHF/JPY Daily chart is exhibiting some buying potential. We're looking at an impulsive up move, followed by a corrective down move back to the 21 and 8 EMA's. We may be looking at a rejuvenation of the upside capability ...
Investing Academy Trading&Money Management Courses
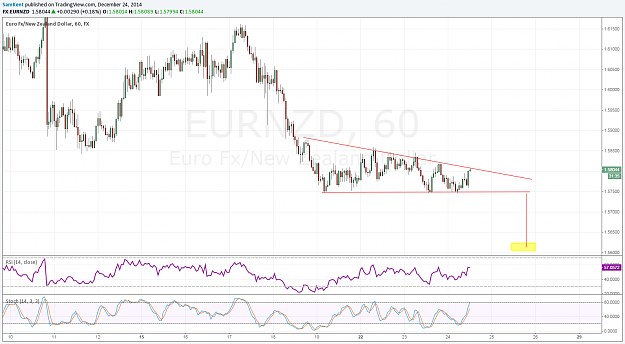
- SamKent replied Dec 24, 2014
EUR/NZD DESCENDING TRIANGLE We're looking at this descending triangle on the EUR/NZD 1H chart as a good selling opportunity, backed by overbought stochastic readings, as well as an overall bearish market structure, with a preceding impulsive wave ...
Investing Academy Trading&Money Management Courses
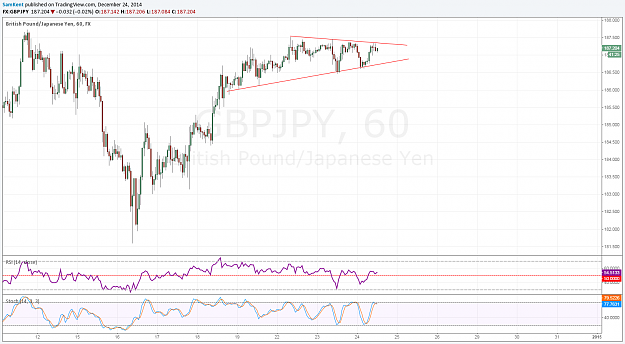
- SamKent replied Dec 24, 2014
GBP/JPY LOOKING FOR PATTERN BREAKOUT The GBP/JPY 1H chart is consolidating in what appears to be some sort of a wedge formation. The overall directional bias is to the upside, with the RSI holding above 50 thus far, and stochastic being near ...
Investing Academy Trading&Money Management Courses