- Search Crypto Craft
- 89 Results (1 Thread , 88 Replies )
- Rustyyy replied Aug 27, 2008
Tomorrow my friend is a reversal day. Every Thursday before US Labor Day weekend for the last 11 years has been a DOWN day for US equities and USD. It will be on tomorrow for sure!!!!
Auslanco - GBP/JPY and GBP/USD (newstrade)

- Rustyyy replied Jul 24, 2008
Little confused — Lilmoe...yes I was short. Picked up some retracement longs at 213.00 area, looking for 4HR 5SMA. Weekly chart. Please take a look. Momentums down and crossing my little 8SMA which I use for signals. Last time this happened we ...
Auslanco - GBP/JPY and GBP/USD (newstrade)
- Rustyyy replied Jul 22, 2008
Interesting — First 1HR bar to open below this T/L since July 16th. Well, that is, if it stays there....
Auslanco - GBP/JPY and GBP/USD (newstrade)
 Anyway...just a little food for thought.
- Rustyyy replied Jul 19, 2008
Just some thoughts — Cautiously bullish... Looking at the daily chart it sure does seem like we have seen this pattern before (circled areas). 214.00 area is going to be a tough nut to crack, if it does, up up and up we go.... If it does not ...
Auslanco - GBP/JPY and GBP/USD (newstrade)
- Rustyyy replied Jul 17, 2008
Up we go....then down? — Looks like we are on our way back up. New daily bar opened just above Daily 200SMA. QQE is crossed up. I believe the retracement was within the last bar itself. But not too sure about this one. Break 214.00 long. If ...
Auslanco - GBP/JPY and GBP/USD (newstrade)
- Rustyyy replied Jul 17, 2008
Where to from here ??? — Price sitting close to Daily Gann. 211.88. Also 61.8 from from total move down from 213.90 area. Retrace from here to 210.60 area and then back up? Sure wouldn't want to go long here....but what the hell do I know.... ...
Auslanco - GBP/JPY and GBP/USD (newstrade)
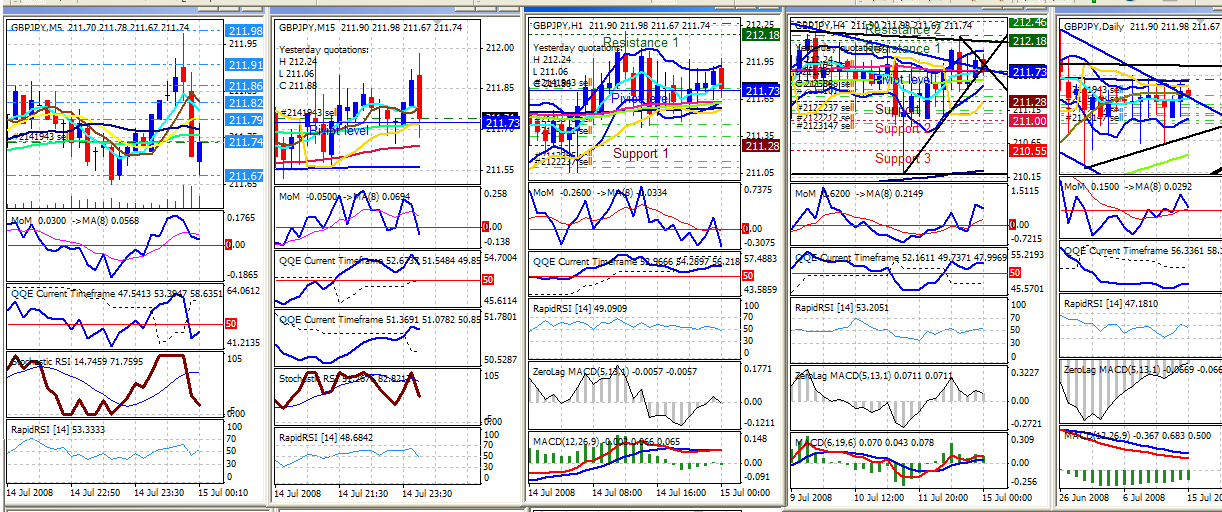
- Rustyyy replied Jul 15, 2008
Stuck? — Are we going to get stuck between Daily 200 SMA(Blue) and 50 EMA(Green) ? Hope not. But I sure don't see enough momentum to break above this area. Unless Bush announces he can actually make oil appear out of thin air !!!
Auslanco - GBP/JPY and GBP/USD (newstrade) What a ...
- Rustyyy replied Jul 15, 2008
Thank you Malcolmb. If the 1HR 50EMA holds I am thinking to hold overnight into Wednesday for interest. But not too sure....
Auslanco - GBP/JPY and GBP/USD (newstrade)
- Rustyyy replied Jul 15, 2008
Time for some charts — G/Y bounced off daily T/L. Dollar strength returning, oil is dropping. Vix spiked. Should retrace to 210.40-210.50 area, 50% and broken T/L. G/Y loves to revisit broken T/L Gopher; Cooking nice pinbar on 4HR, maybe ...
Auslanco - GBP/JPY and GBP/USD (newstrade)

- Rustyyy replied Jul 14, 2008
Buy signal is not valid. QQE's are mixed and Daily is crossed down. Also (and I borrowed this from Quecee) price has not been able to close above Daily 21SMA for 12 days. JMVHO
Auslanco - GBP/JPY and GBP/USD (newstrade)
- Rustyyy replied Jul 9, 2008
Nice call on dollar weakness. If we get a cross down on 1HR QQE it should take us back down to 210.00 area. 4HR came up and kissed and now starting to reverse. Possibly 209.80 ??
Auslanco - GBP/JPY and GBP/USD (newstrade)
- Rustyyy replied Jul 9, 2008
Looks good my friend. Here is my 4HR. We do have some more room to move down. But I am going to lock some profit in....
Auslanco - GBP/JPY and GBP/USD (newstrade)
- Rustyyy replied Jul 8, 2008
Agreed — Been posting this weekly chart for a while.... Indicators starting to rollover. Last time the momentum crossed down my 8SMA it dropped 2200 pips or so in two weeks. Same pattern as last summer except bigger this time. I expect minimum ...
Auslanco - GBP/JPY and GBP/USD (newstrade)
- Rustyyy replied Jul 8, 2008
Great thread — USD/JPY trade is a good risk/reward. Strong support on 4HR T/L and 4HR 200 SMA (Blue line) In for the ride.
No Brainer Trades
- Rustyyy replied Jul 7, 2008
Alrighty then... — 4 Hour chart for you. Sitting on Gann and 4HR 5SMA low. Close below gann. Short. Not yet. QQE cross down below 50. Short. Almost. MACD cross down. Short. Check. Momentum cross 0 line down. Short. Check. 1HR close below ...
Auslanco - GBP/JPY and GBP/USD (newstrade)
- Rustyyy replied Jul 2, 2008
Weekly — Weekly chart Momentums rolling over. Zerolag MACD rolling over. Rapid RSI rolling over. First time in a while. Solid indication of change in direction. JMVHO and 1 1/2 cents.
Auslanco - GBP/JPY and GBP/USD (newstrade)
- Rustyyy replied Jul 2, 2008
Bye DOW, Bye Dollar, Bye S&P, Bye Euro. Trichet playing the same game as Bernanke. Verbally wishing your currency is strong is a lot different than actual strength. No rate hike, E/U will t,t,t, tumble. Bad NFP, dollar will tumble with little rise ...
Auslanco - GBP/JPY and GBP/USD (newstrade)
- Rustyyy replied Jul 1, 2008
Back down she goes. — Here is another of my guesses....
Auslanco - GBP/JPY and GBP/USD (newstrade)
 18 4HR bars cannot close above 4HR 50 EMA. On the flipside cannot close BELOW daily 200SMA 211.20 area for several days. Keeps taking a peek but cannot close below. Daily ...
- Rustyyy replied Jul 1, 2008
Good for longs would be a close above the circled area on my chart. Which is also the descending t/l resistance. 4HR Gann and 4HR 50EMA. If you can get a close above all that resistance. Then up she goes. Above the daily pivot would be a good start. ...
Auslanco - GBP/JPY and GBP/USD (newstrade)
- Rustyyy replied Jul 1, 2008
Time for a chart — G/Y below 4HR and Daily Gann. T/L is intact. Downward channel intact.
Auslanco - GBP/JPY and GBP/USD (newstrade)