- Search Crypto Craft
- 21 Results
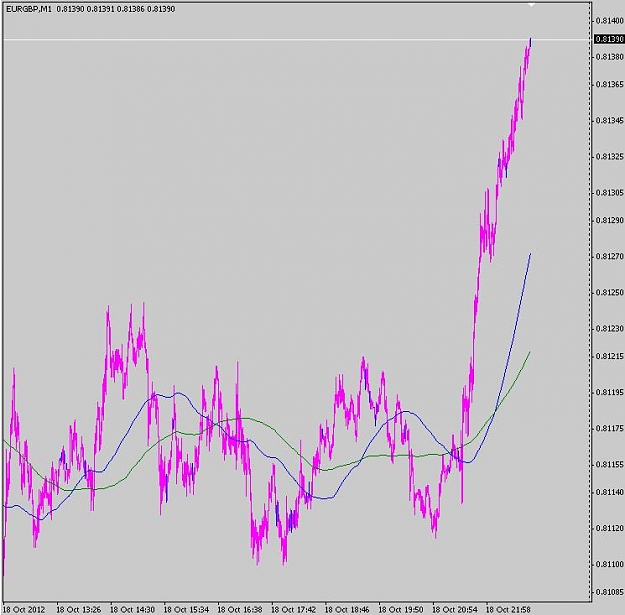
- RWalker replied Oct 18, 2012
I think the mission of gbpusd is to rip every stop between here and 1.6000 I should have bought eurgbp! image
Cable Update (GBPUSD)
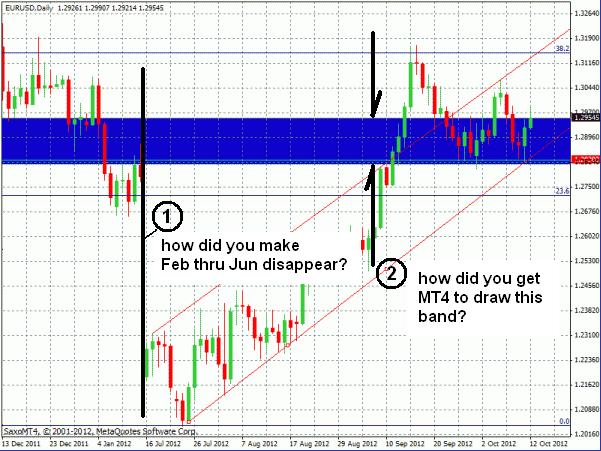
- RWalker replied Oct 14, 2012
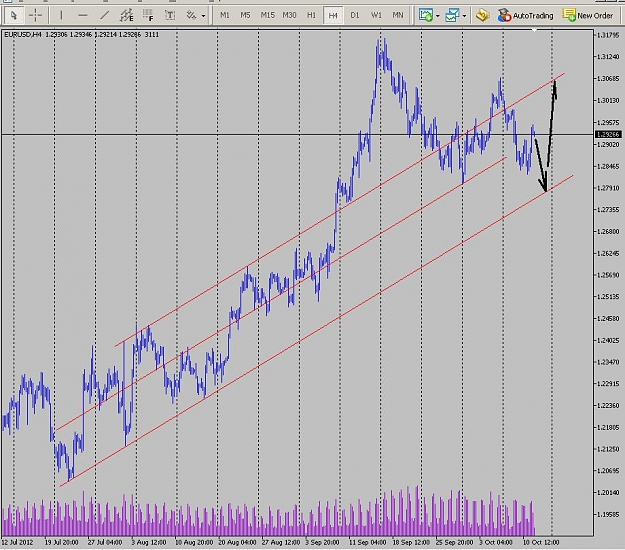
image Does anyone know: 1. how you make Feb thru Jun disappear from this MT4 chart? (it doesn't look like it was post-edited) 2. how you make MT4 display a wide horizontal bar in the background?
EURUSD
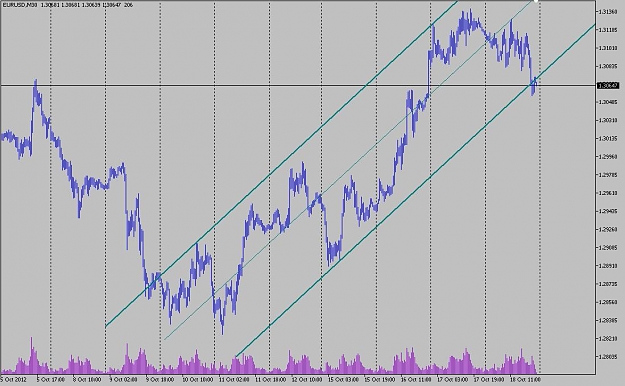
- RWalker replied Oct 11, 2012
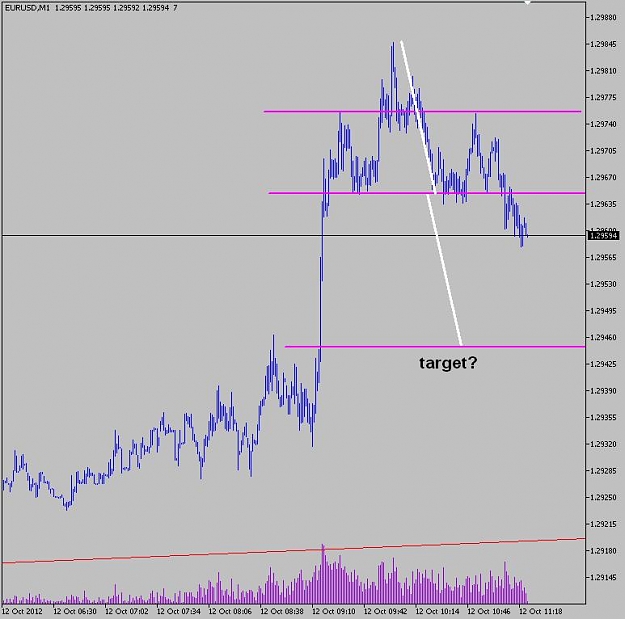
Here is an alternate tl view which suggests that DOWN is next move: image PS: typ 50% retrace not done yet... for today's move.
EURUSD
- RWalker replied Aug 13, 2012
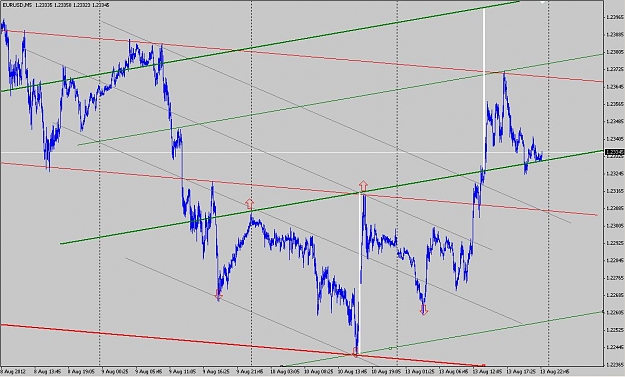
Neckline rejection? — Price has been grinding against H+S neckline for last hour, but: image is now turning up. If no bounce off bottom of uptrend from this NY afternoon... may head for upper target @ about 2403. (and might just do it before ...
EURUSD
- RWalker replied Aug 13, 2012
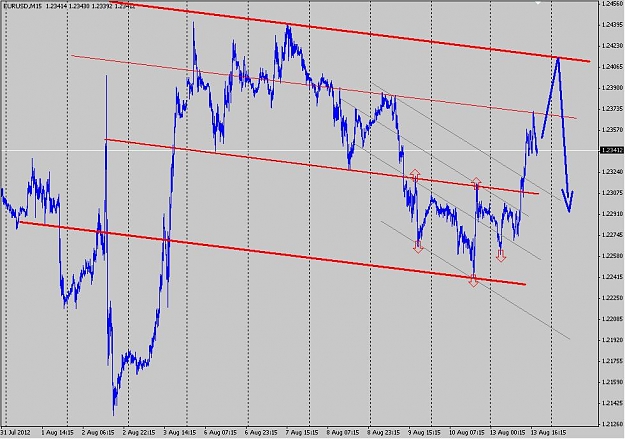
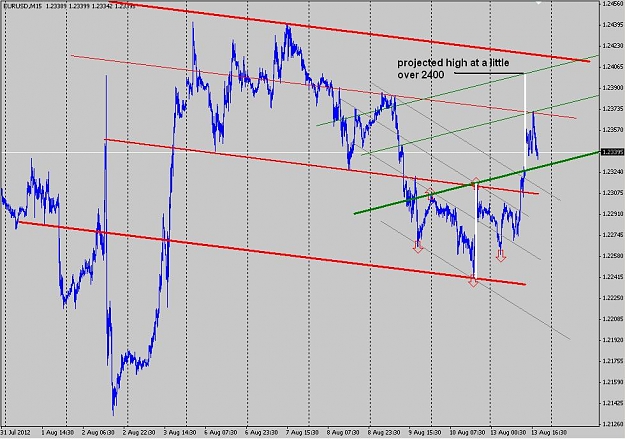
That is consistent with the idea that price will bounce off the top of the down channel from last week: image before it starts going down again. Bounce would be expected btwn 2410 and 2415.
EURUSD
- RWalker replied Aug 13, 2012
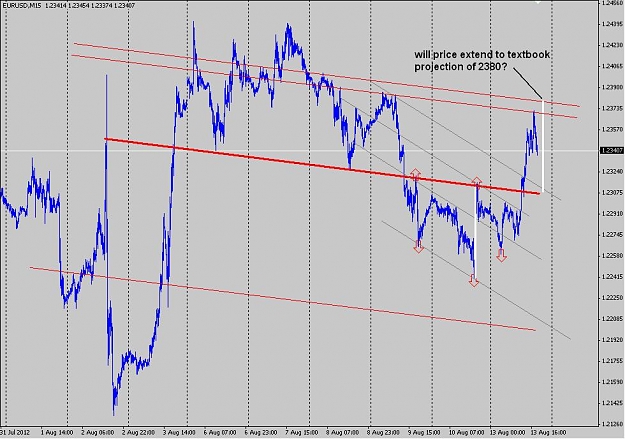
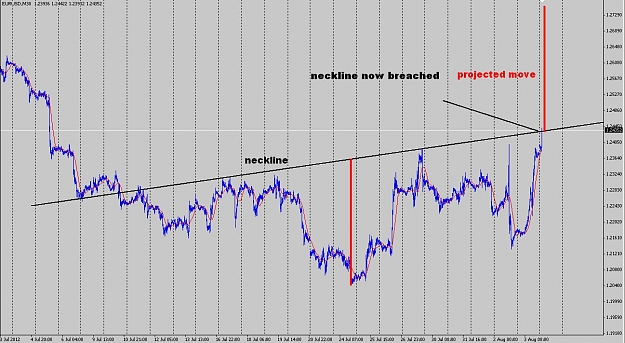
Another head and shoulders — The most recent head and shoulders (inverted): image shows a textbook target projection of 2380. Price was stopped earlier at the echo TL level from last Thursday... ================== OOOPS!!!! big mistake ...
EURUSD
- RWalker replied Aug 12, 2012
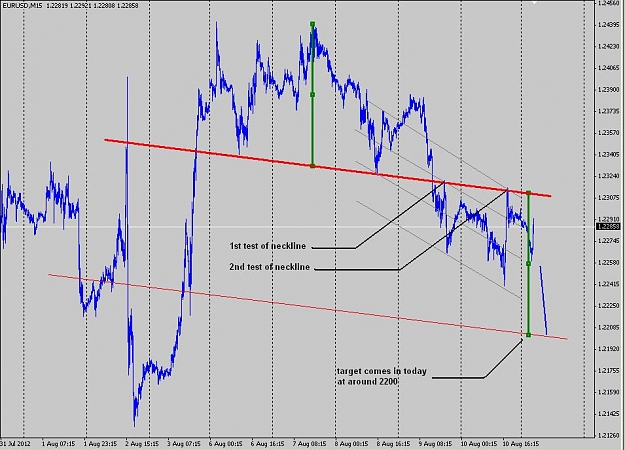
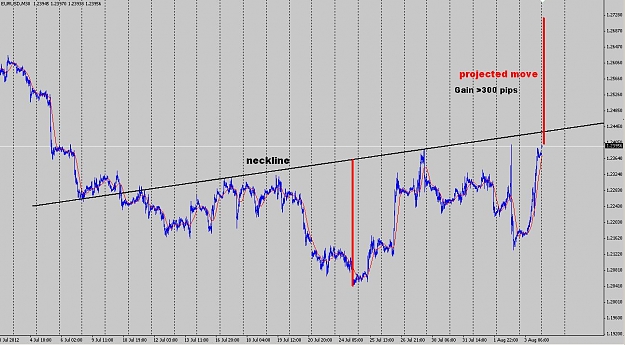
A chart pattern view — The uptrend from mid-July has led to this: image The neckline has contained price twice now... if this H+S follows the textbook, approximate target is 2200. If the neckline contains further up moves today, it will have ...
EURUSD
- RWalker replied Aug 7, 2012
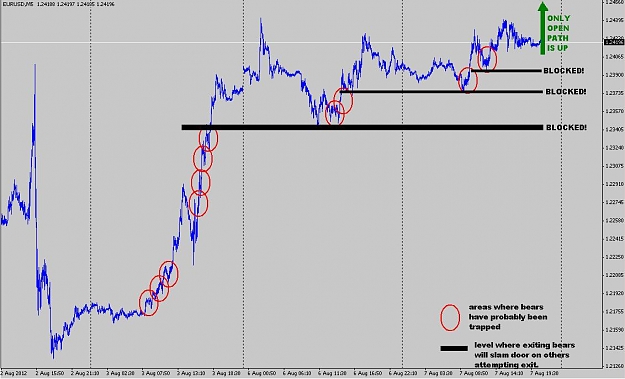
Why E/U will probably keep going up — Here is one view of the situation with eur/usd that in some sense supercedes technicals because it addresses the existing situation, not one that will develop: image 3 levels: 2400, 2375 and 2350 (the ...
EURUSD
- RWalker replied Aug 6, 2012
Long again from 2378 (SL: 2370)... image Still respecting green TL system developed last night... neckline of H+S from early July comes in around 2435 today - a break, by the book, targets 2700+
EURUSD
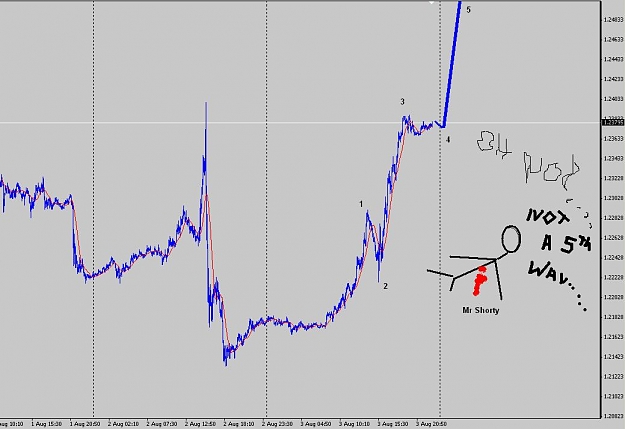
- RWalker replied Aug 5, 2012
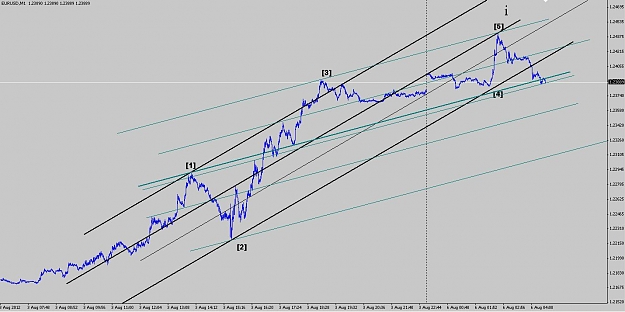
Second uptrend system (green lines) develops, showing continued upward momentum... image ...strengthens notion that completed Elliot impulse just seen is wave 1 of much larger wave leading to 2700+ - also consistent with break and continuation of ...
EURUSD
- RWalker replied Aug 5, 2012
Too late for longs? Really? — I trade shorter TF's so I don't pay too much attention to H+S ... and maybe that's why I'm confused. I just reviewed several textbook explanations of H+S patterns and now I really am confused I'm probably making ...
EURUSD
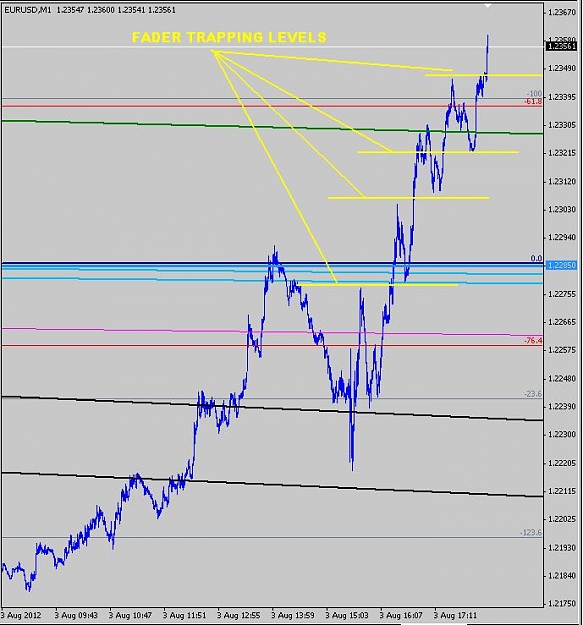
- RWalker replied Aug 3, 2012
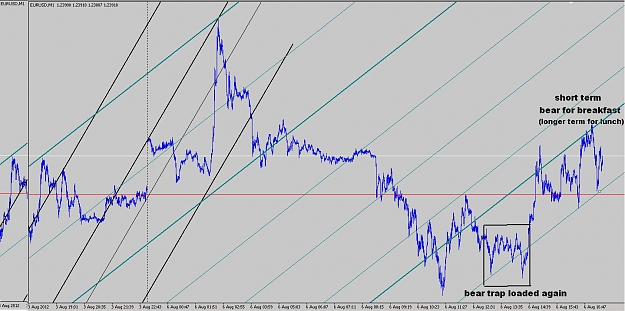
to clarify... — image to be a little more specific, the trick is: 1. make you think you see a top (no bad news - it's gotta turn around!) 2. get you to go short 3. drive the price above what you thought was a top (most recent yellow line) 4. ...
EURUSD

- RWalker replied Aug 3, 2012
Bear trap is full now. Price move to 2450-2500 range on Monday should skin quite a few of them. image
EURUSD
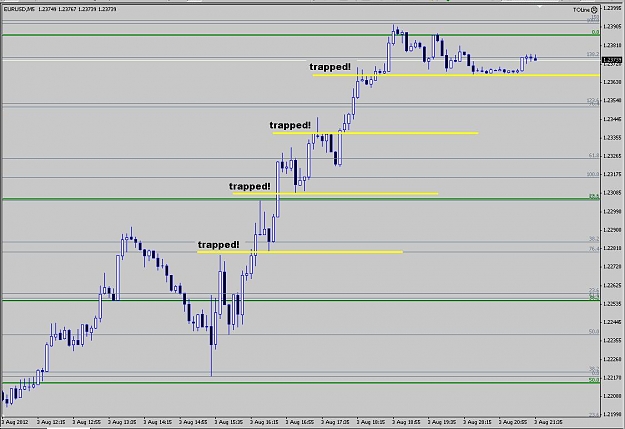
- RWalker replied Aug 3, 2012
Dinner now in larder. Expect price to stay well above 2312 past weekend while shorts "cook-off" (ouch...ouch...ouch!!) The quick bear faders have been trapped. image They really like doing this on a Friday! The price won't return to earth today... ...
EURUSD
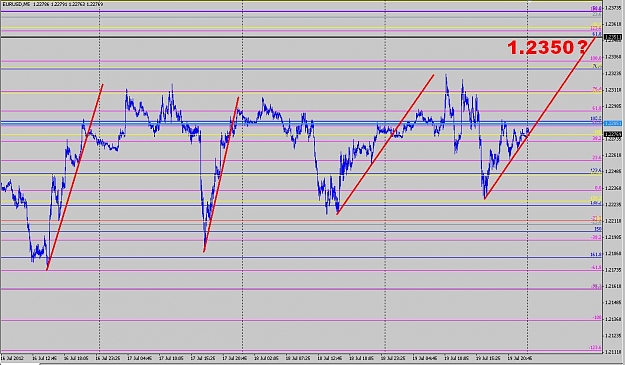
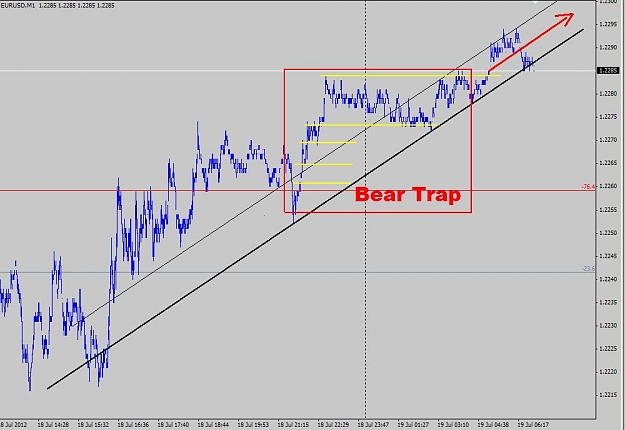
- RWalker replied Jul 19, 2012
Looks like bear trap is full of bears... stairstepping seems to have ended - now plain old wild stop run channel to the moon? Breakout just now, but price bouncing off familiar old 2285 from June 1st: image
EURUSD