- Search Crypto Craft
- 42 Results
-
 Pipskateer replied Dec 21, 2014
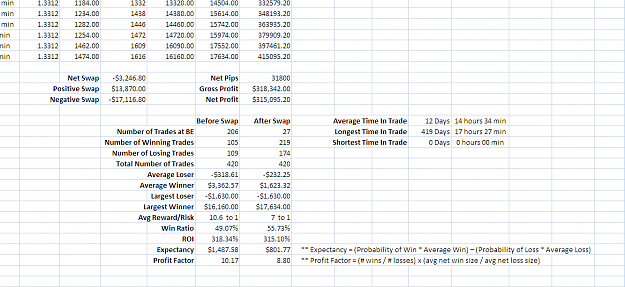
That's very impressive and very encouraging! I took the liberty of adding some summary calculations at the bottom, the focus of which was to show the effects of the swap on performance and bottom line. I also modified the date fields to Excel format ...
Building an equity millipede
- Pipskateer replied Dec 13, 2014
Ok, very good then. I'll stay on it. Will take me a while to collate the other works and will post when I'm done. I was hoping that Alien had given some additional information on his other systems since June, but he's been very busy with UFO stuff ...
Alien's Extraterrestrial Visual Systems

- Pipskateer replied Dec 11, 2014
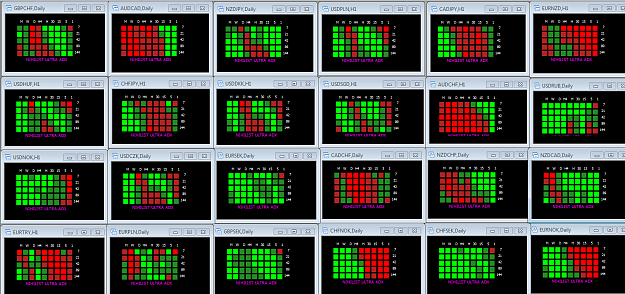
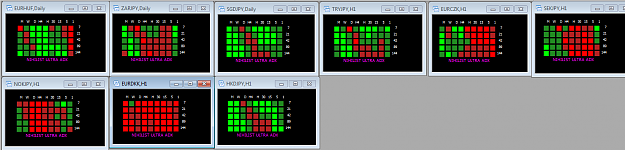
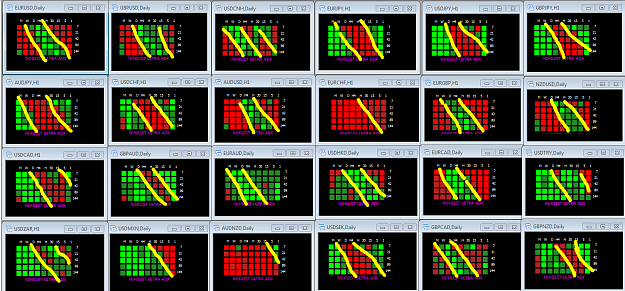
I don't want to make more out of this than is justified, but I really find this ADX "pattern" to be very intriguing. I have 57 pairs on my terminal and I find it amazing that this diagonal distribution of buy/sell waves is apparent on all of them. ...
Alien's Extraterrestrial Visual Systems
- Pipskateer replied Dec 11, 2014
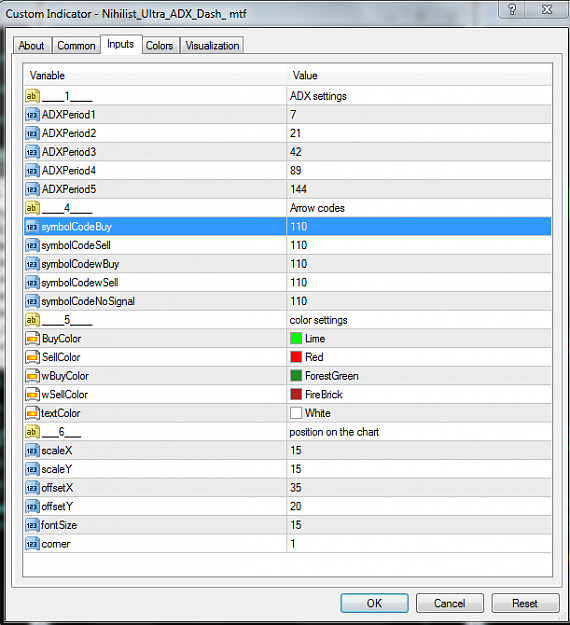
Sure thing. I believe I only changed the two "wbuy/wsell" colors. image
Alien's Extraterrestrial Visual Systems
- Pipskateer replied Dec 9, 2014
Yes! That's exactly what it looks like to me. Notice that the "waves" roll across the indicator in a diagonal pattern from lowest TF to highest TF and you can see it on every pair in almost this same fashion. Some pairs are more defined than others, ...
Alien's Extraterrestrial Visual Systems

- Pipskateer replied Dec 9, 2014
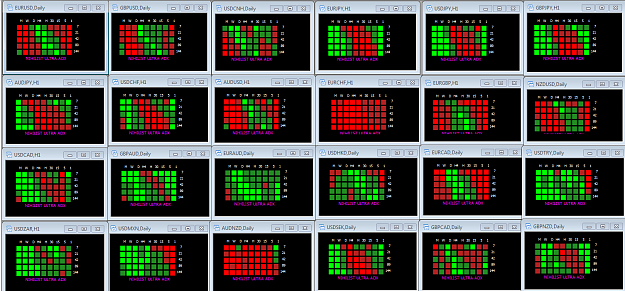
I don't know if this will be helpful, but I noticed a pattern using Nihilist's Ultra ADX indicator after I made some adjustments to the color scheme. He was using a blue and orange color to indicate a "weak buy/weak sell" and red and lime green for ...
Alien's Extraterrestrial Visual Systems

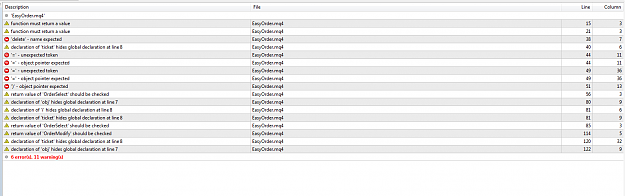
- Pipskateer replied Nov 27, 2014
Looks like a great tool, but cannot get it to run on Build 745 at all. The main EasyOrder script file would not compile. Here are the errors from MetaEditor: image I tried it on FXCM and FinFx, both 745 builds and neither would run it. I have 2008 ...
MT4 Order Plugin: Trade by lines with risk based lot sizing
- Pipskateer replied Dec 13, 2013
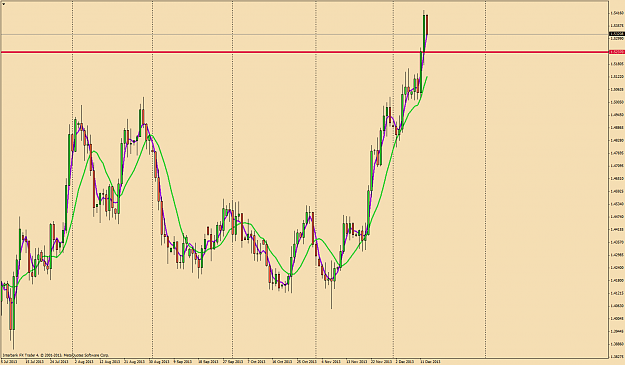
I'm watching the EURAUD on this possible setup: image url Momentum push out of consolidation area in an uptrend. Major monthly/yearly support area coming up, but I think there's room for a 10R trade if you get an entry at the 1.5237 area.
The 10XROI System - A High "R" Factor Approach
- Pipskateer replied Nov 23, 2013
Originally, I wanted to post this information in one of the reserved posts at the beginning, but it will just have to go here. There is a money management risk enhancement to this system that is something very much worth considering. It has the ...
The 10XROI System - A High "R" Factor Approach
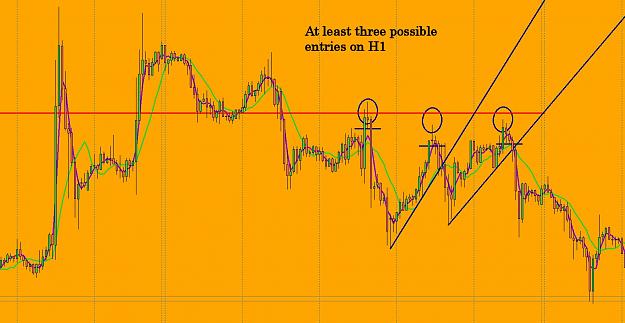
- Pipskateer replied Nov 22, 2013
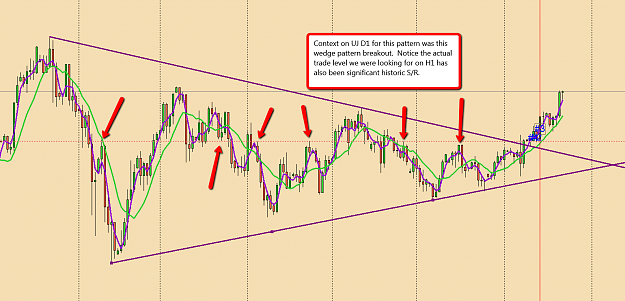
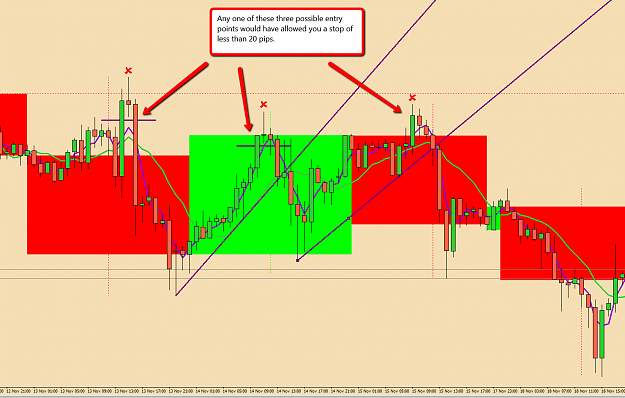
And here is the H1 chart with possible entries for the UJ Push Pull pattern: image
The 10XROI System - A High "R" Factor Approach
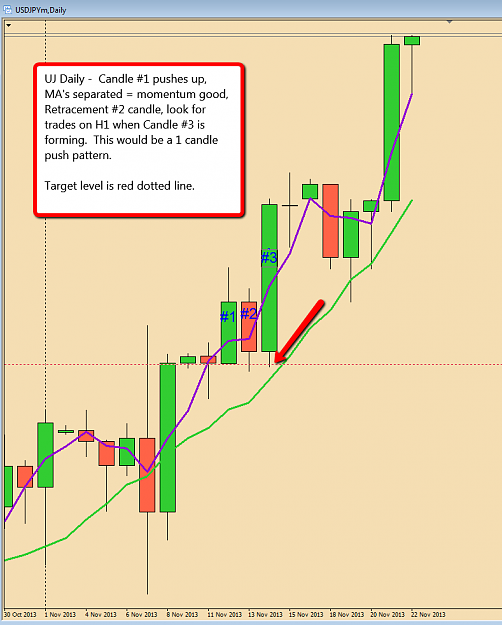
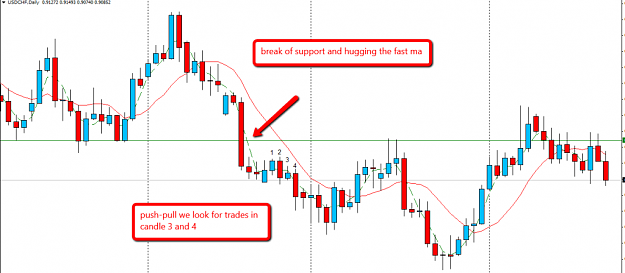
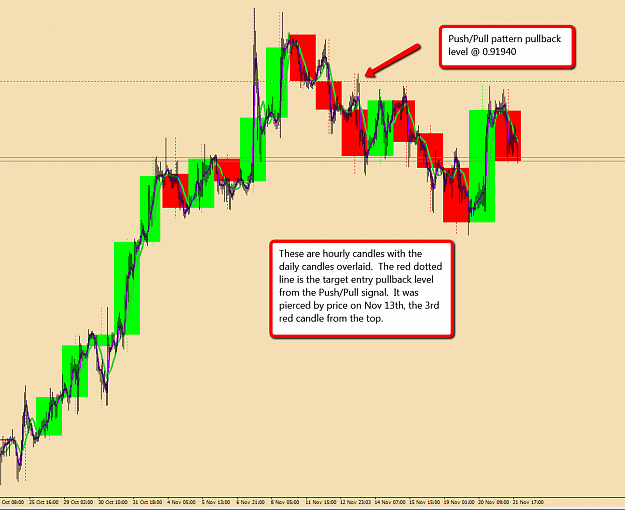
- Pipskateer replied Nov 22, 2013
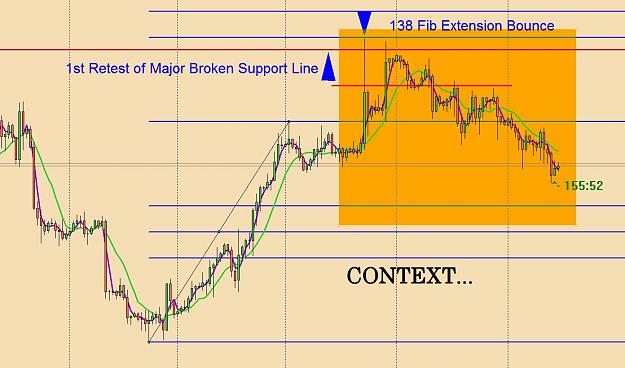
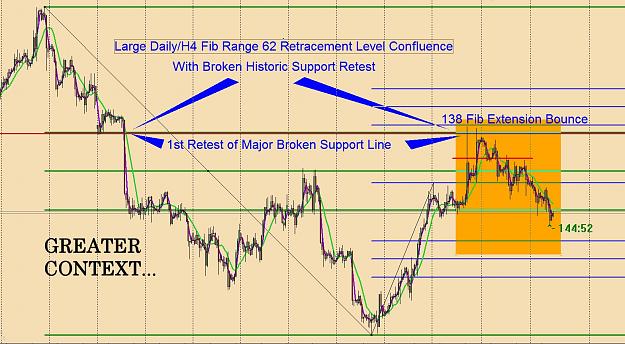
Here's another one I just found on UJ Daily: image Here's the context on zoom out: image
The 10XROI System - A High "R" Factor Approach
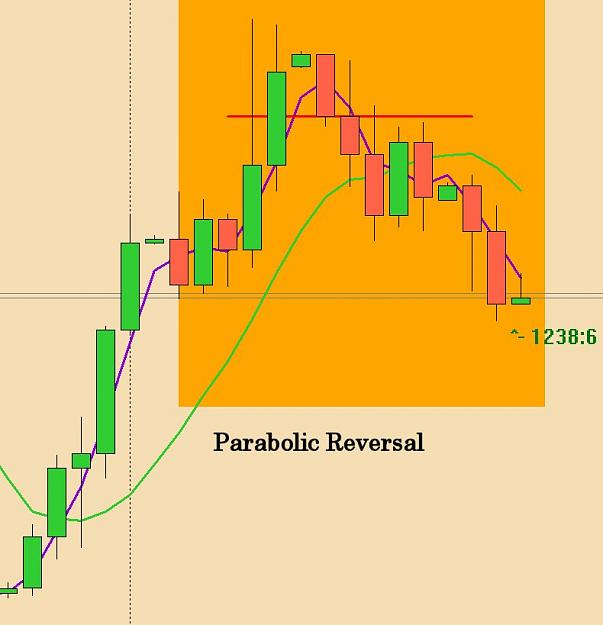
- Pipskateer replied Nov 22, 2013
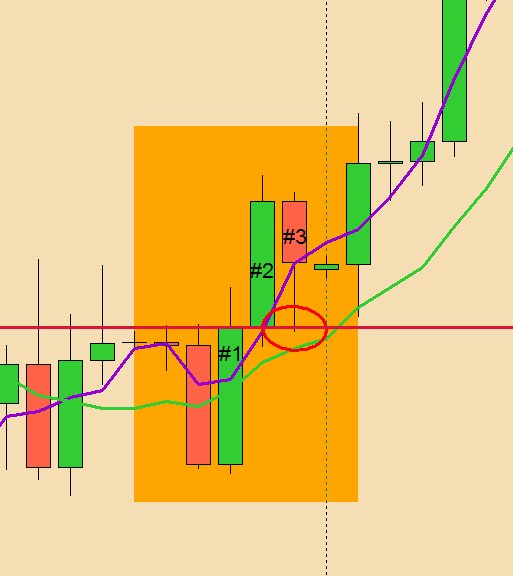
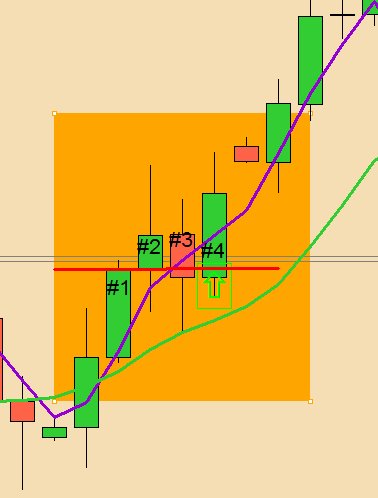
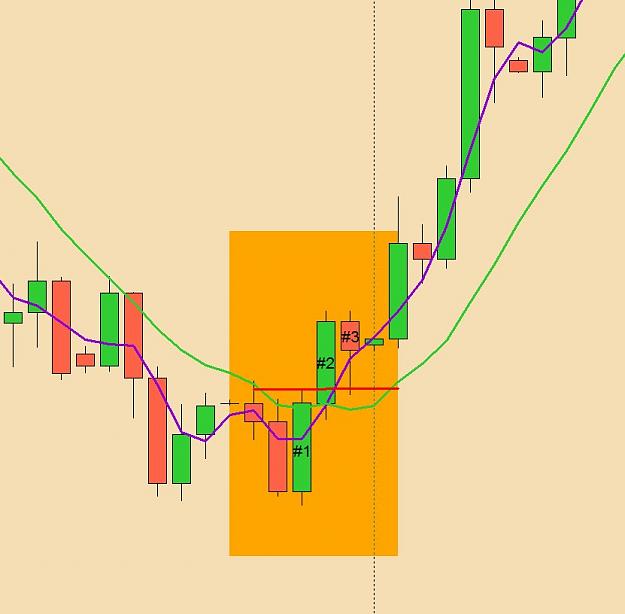
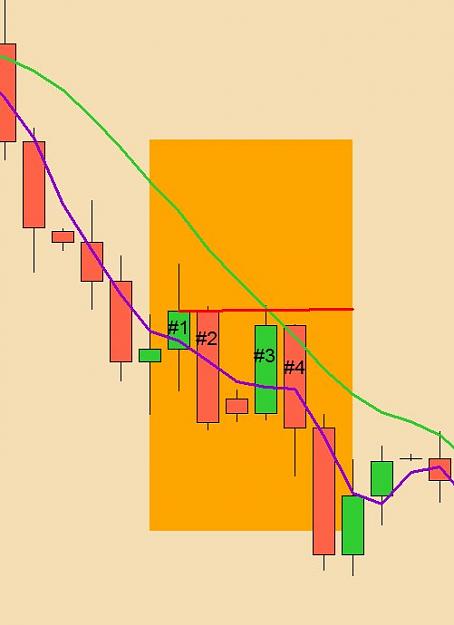
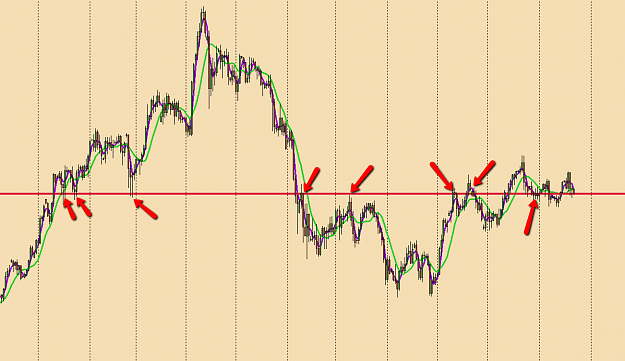
I have a few examples of Push/Pull candle patterns from the system creator that I'd like to post in an effort to further clarify the pattern for you. NOTE: Some of these patterns are on charts OTHER than D1...but that is only to show examples of the ...
The 10XROI System - A High "R" Factor Approach

- Pipskateer replied Nov 21, 2013
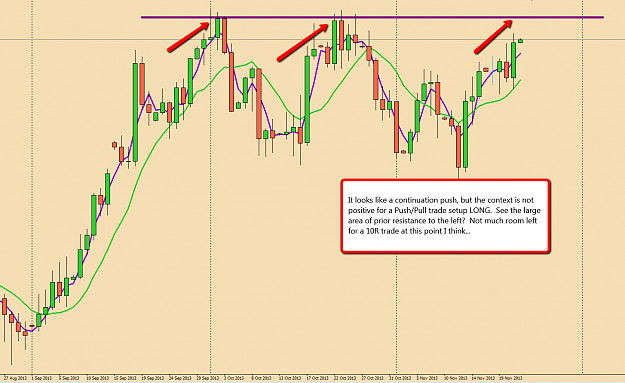
Right, and this is something that doesn't seem to fit the Push/Pull examples I've seen, but it may work. You would have to backtest this variant to see if it causes signifcant trouble. If you look to the left of the chart, the context is one of ...
The 10XROI System - A High "R" Factor Approach
- Pipskateer replied Nov 21, 2013
It might...except that... image There is also no complete pattern here yet. You have basically one momentum candle in a continuation of a trend about to run into major resistance.
The 10XROI System - A High "R" Factor Approach
- Pipskateer replied Nov 21, 2013
Ok, I'm working on the presumption that DO understand how to determine the correct entry LEVEL once you've identified a Push/Pull candle pattern. If not, then let me know. You are basically looking for some kind of technical entry, such as a ...
The 10XROI System - A High "R" Factor Approach
- Pipskateer replied Nov 21, 2013
Ok, that helps me understand better how to help you. I'll put something together that should help. Kinda busy this morning, so it will be later today. In the meantime, here is a setup and entry on the USDJPY. image Notice the stop was large on the ...
The 10XROI System - A High "R" Factor Approach
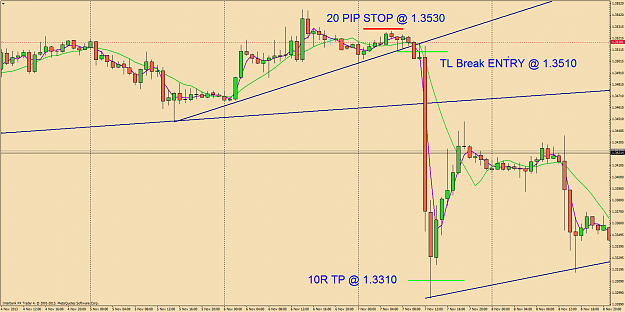
- Pipskateer replied Nov 21, 2013
No....we wait for a new Push/Pull pattern to form. The Push/Pull setup short level on EURUSD was near 1.3515-1.3517 as you have correctly marked on your D1 chart. However, that trade should have already been entered on the H1 chart as shown in POST ...
The 10XROI System - A High "R" Factor Approach
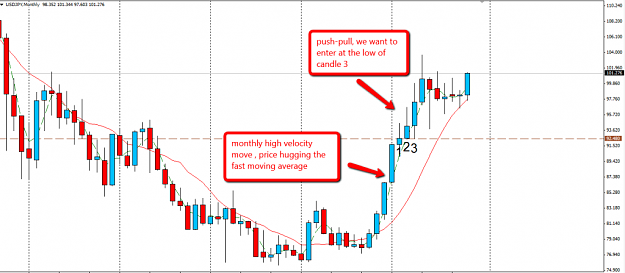
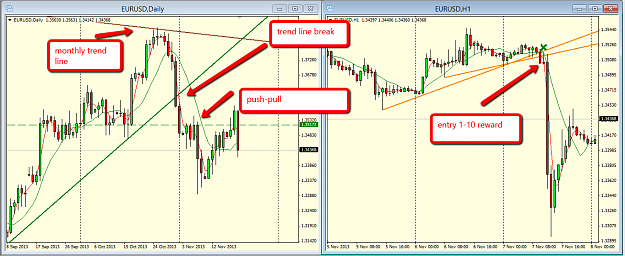
- Pipskateer replied Nov 20, 2013
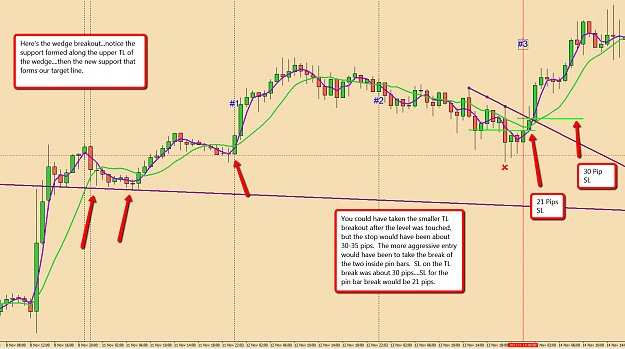
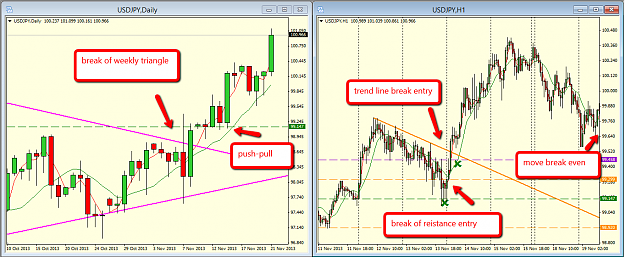
Here is an example of a classic, text book trade, sent to me by the author. See if this helps you get a better idea of what to look for. First, there is a monthly trendline break...then a One Candle Push/Pull pattern. The H1 chart shows the entry ...
The 10XROI System - A High "R" Factor Approach
- Pipskateer replied Nov 19, 2013
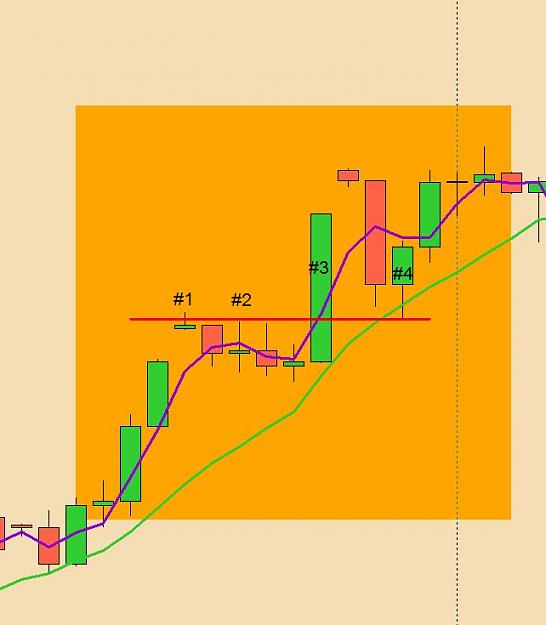
The logic behind the Push/Pull candle pattern is not rocket science. We're basically looking to identify a level where we can enter the market at an extreme pull-back point following a momentum push. We'll identify these extreme pull-backs on the H1 ...
The 10XROI System - A High "R" Factor Approach
- Pipskateer replied Nov 19, 2013
SETUPS: Setups will be identified on the D1 charts. We do NOT trade setups. Setups are merely where we begin looking for QUALIFIED ENTRIES. Our setups will begin with the occurence of a "Push-Pull" candle pattern. This pattern is formed when price ...
The 10XROI System - A High "R" Factor Approach