- Search Crypto Craft
- 9 Results
- OzorioFX replied Aug 9, 2010
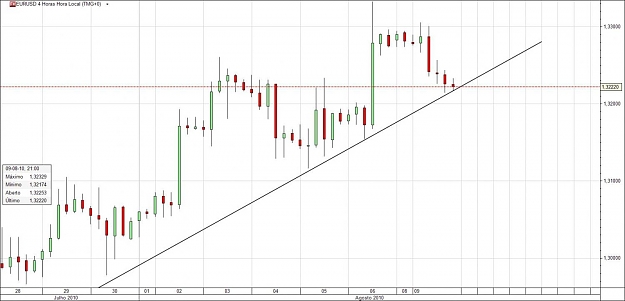
This 4 hour graphic shows the bottom of the bullish channel. Touched again today, if it holds, this is a good place to longs.
EURUSD
- OzorioFX replied Feb 27, 2009
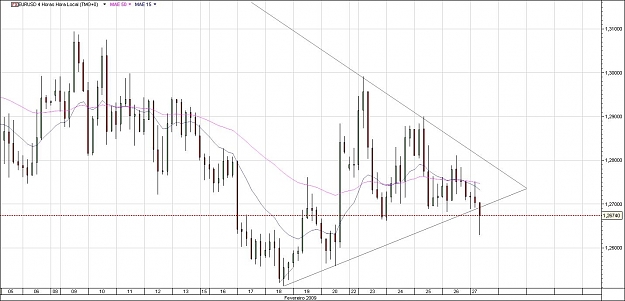
Triangle broken to the downside — Has shown in the picture, triangle PA that ruled the movement for some time is broken and to the downside. This isnt surprising, since we are ending the week and the month, and large amount of money will flow ...
EURUSD
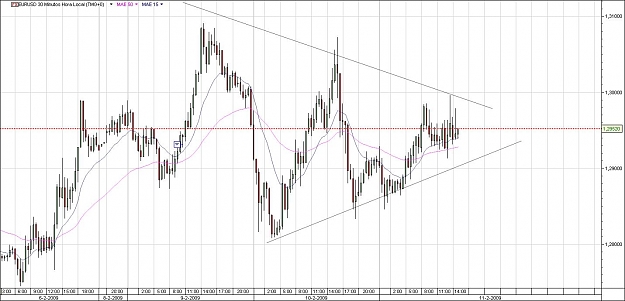
- OzorioFX replied Feb 26, 2009
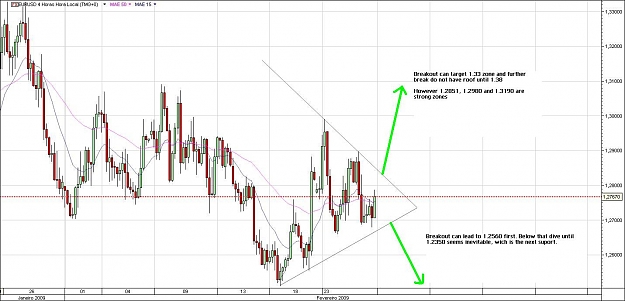
Traingle pattern Continuation. PA Preview — Attached the figure i used this week. The triangle is evident, and PA right now seems narrowing the range to something between 1.2680-1.2780. Stochastics sugest upmove. Other indicators also sugest ...
EURUSD
- OzorioFX replied Feb 25, 2009
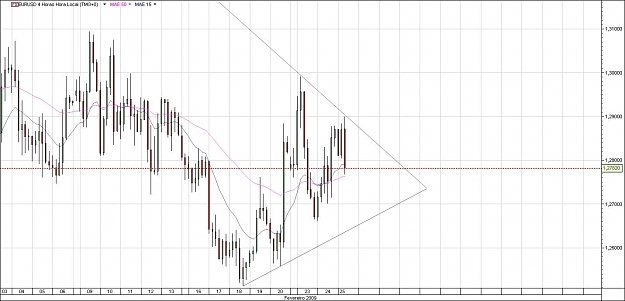
4 Hour triangle — In the picture is shown a triangle wich boundaries have resisted to various tests. Tested the upper limit today, and with EMAs starting to look like sugesting a short, we could see a test to the lower boundarie, wich now is ...
EURUSD
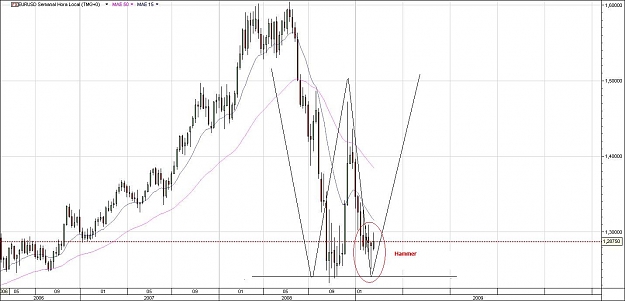
- OzorioFX replied Feb 23, 2009
Weekly Chart with the Hammer and the W — Here it is. Ive read about the false breakout, but if you look at other carry trades, like EURJPY that is skyrocketing and to the pair USDCHF, it seems clear that EURUSD is going up also.
EURUSD
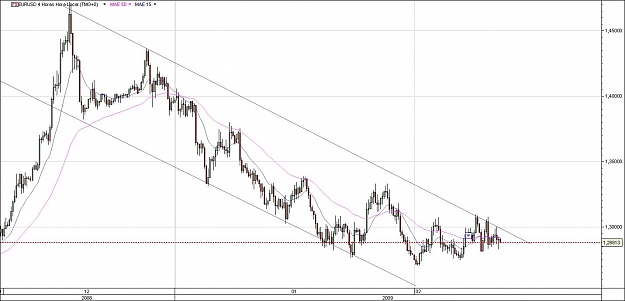
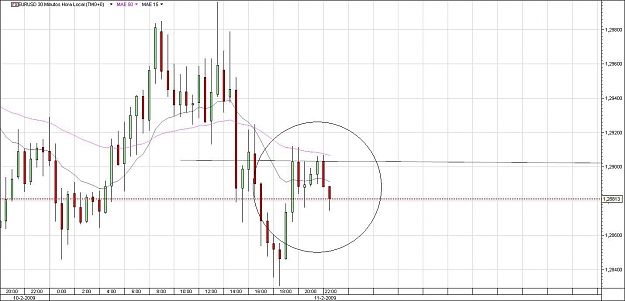
- OzorioFX replied Feb 11, 2009
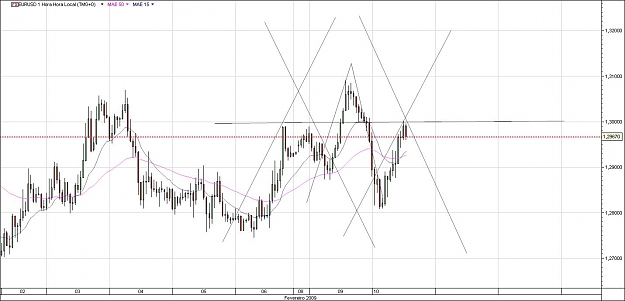
4H Downtrend Channel and Curious resistance in 30 M chart — The first upload represents the Downtrend channel, respected since 1.47s area. Being not violated it now garantees with extreme strenght the 1.30 area as a strong resistance. The 30 ...
EURUSD
- OzorioFX replied Feb 11, 2009
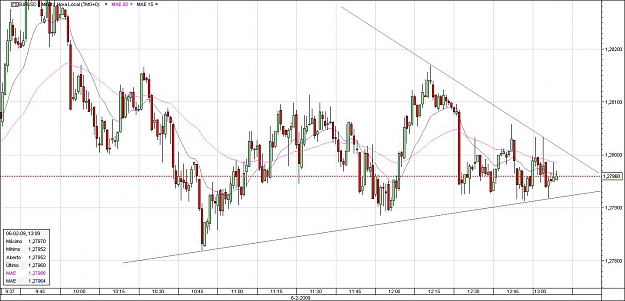
Traingle pattern — Triangle formation on 30 Min chart. Any breakout will be strong. I bet on the downside
EURUSD
- Posts by Member Search: 'OzorioFX'