- Search Crypto Craft
- 26 Results
-
 NorthTrader replied Sep 6, 2016
Probably because not many of us understood exactly what he was implying
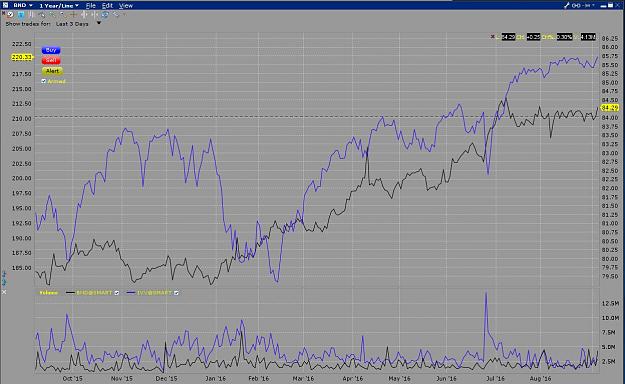
The Really Useless Thread For extra perspective, here's a chart comparing IVV (S&P 500 ETF - blue line) and BND (Total US Bond Market ETF - black line) over the last year. image Both markets seem to ...
- NorthTrader replied Jun 21, 2016
Thanks for the trouble Fool-sensei. I've also found the info on my Interactive Broker's trading platform, as below: image Seems like you can trade it right up until Friday close if you want. Yeah, I see what you mean. My $17 put spread is also in ...
Let's Trade Options

- NorthTrader replied May 5, 2016
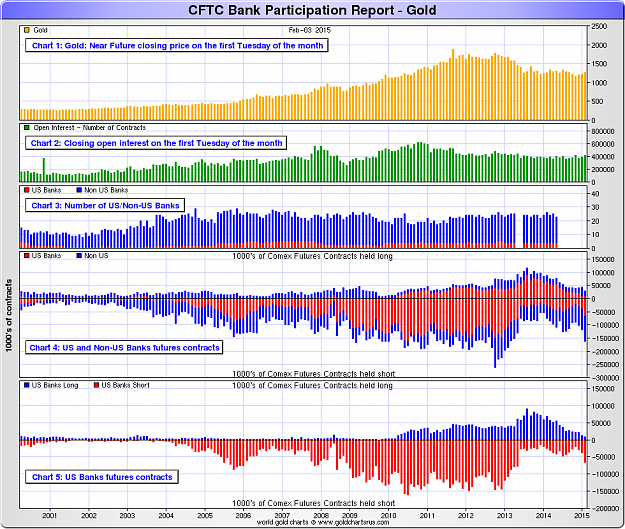
Hey Jay, Just wondering if you can offer any nuggets about how best to interpret these Bank Participation Reports. They don't seem to make much sense at first glance. For instance, the banks have been net long the CME Euro every month since the last ...
Jay's High Probability Setups
- NorthTrader replied Apr 24, 2016
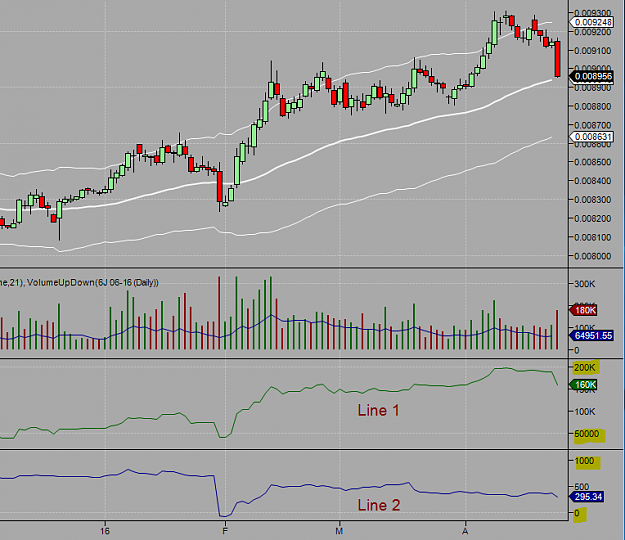
Sure. On the chart below, I have two lines plotted below the price panel: Line 1 and Line 2. These are actually the same indicator with different inputs, but that's not important right now. You can see that the y-axis (vertical scale) of each line ...
Compare the slopes of two lines plotted on different scales
- NorthTrader replied Nov 8, 2015
Hey Fool-san, "distributing the market" is just my parlance for selling strength being greater than buying strength during a ranging phase or upmove. It might be due to taking profit on longs, or it might be due to actively building up short ...
The Really Useless Thread
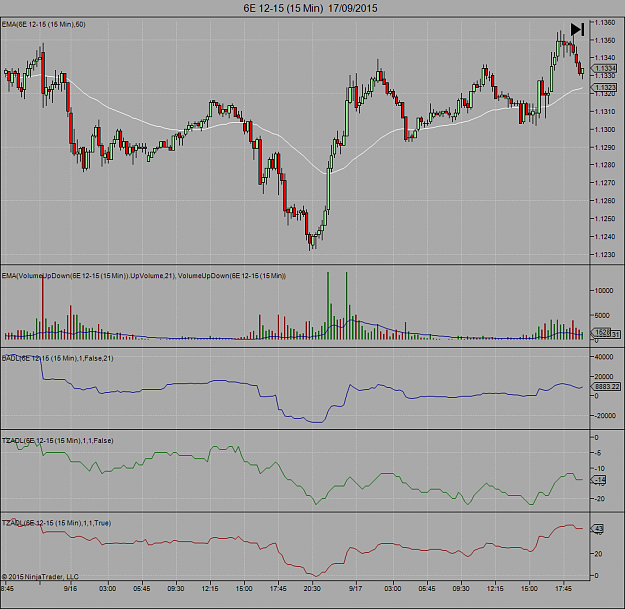
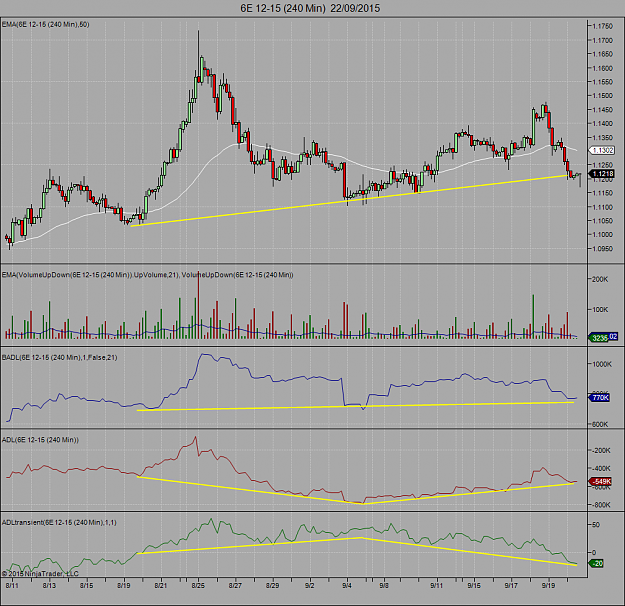
- NorthTrader replied Sep 23, 2015
On these charts: Blue (top): BADL calculating on 1 minute bars Green (middle): TZADL calculating on 1 minute bars, using +1 for Mid Up TZ and -1 for Mid Down TZ Red (bottom): TZADL calculating on 1 minute bars, using TZ heights (in pips) Both TZADLs ...
Better ADL
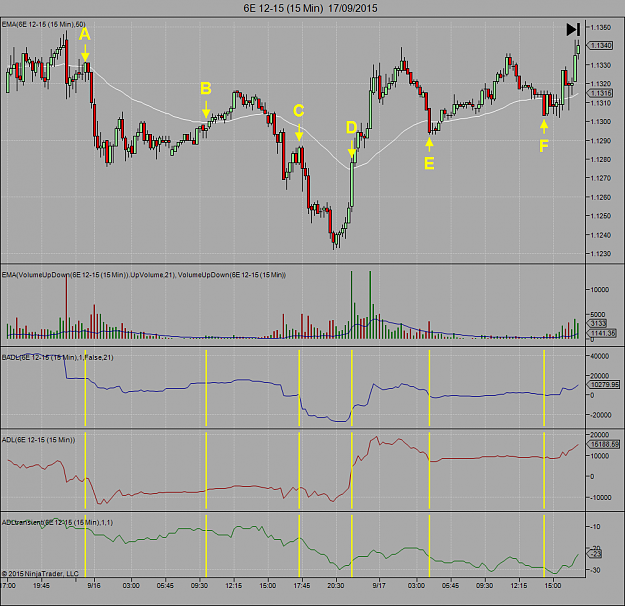
- NorthTrader replied Sep 22, 2015
ADL transient So, here is the same chart as the last post but with kprsa's ADL_transient indicator added. I've removed one of the BADLs for clarity. The lines are: Blue (top): BADL calculating on 1 minute bars Red (middle): original ADL Green ...
Better ADL
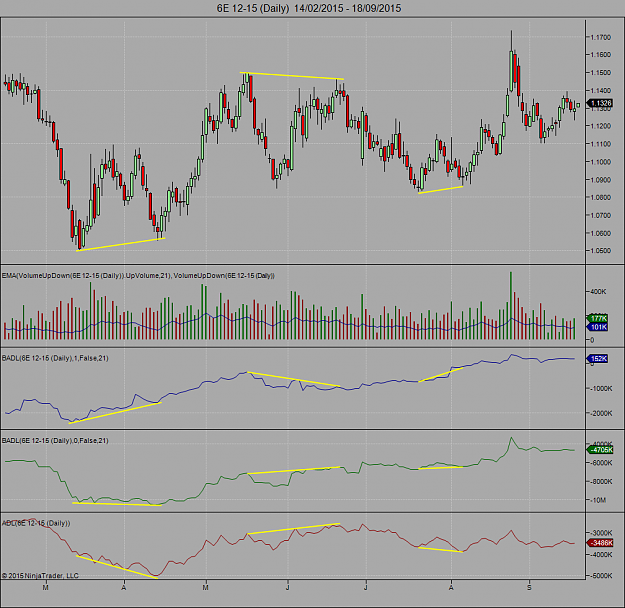
- NorthTrader replied Sep 21, 2015
EUR.USD M15 When you get to lower timeframes, the differences between Better ADL and Original ADL become less obvious. And I've found that a great way to use it, apart from looking for relatively rare divergences, is to gauge the relative strength ...
Better ADL
- NorthTrader replied Sep 17, 2015
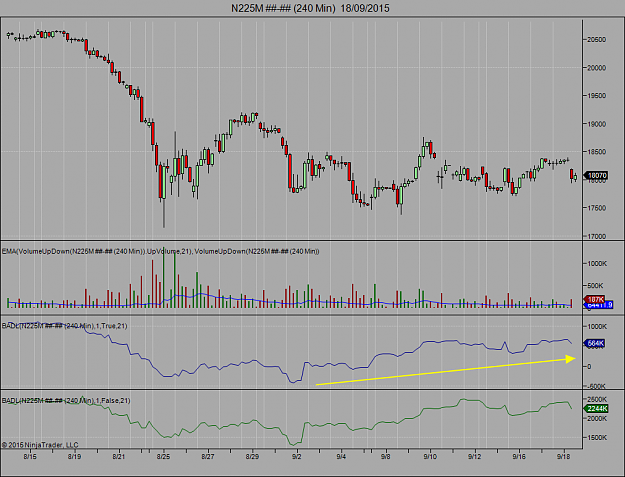
Nikkei Emini M240 Time for equities to rise? (yellow arrow) image By the way, the blue line is Include gap spreads = true (probably better for the Nikkei), and the green line is Include gap spreads = false. Actually it doesn't seem to make a lot ...
Better ADL
- NorthTrader replied Sep 17, 2015
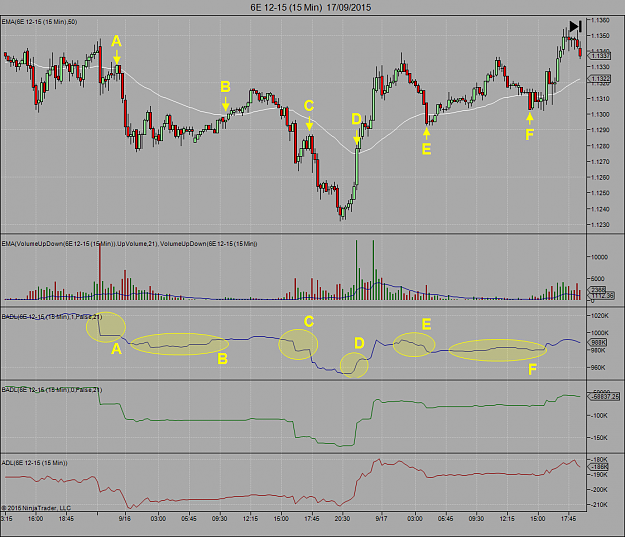
EUR.USD M240 The upmove following FOMC doesn't look so convincing on this scale (BADL blue line), so I'm tightening my stop to 1.1385 (spot price) just in case.
Better ADL
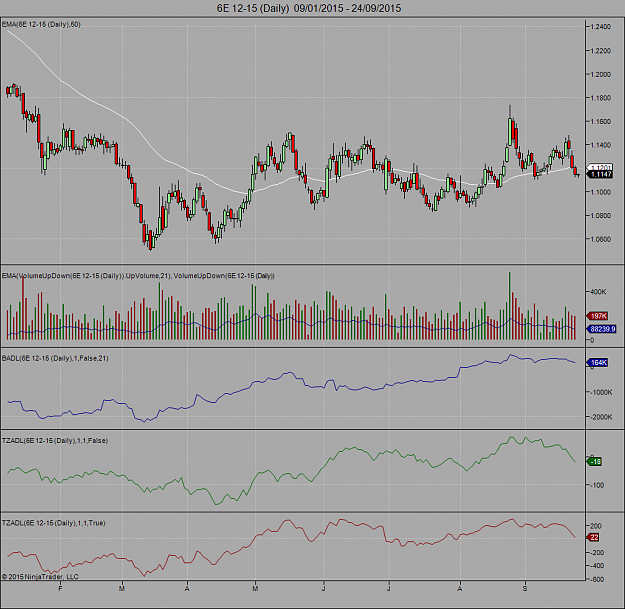
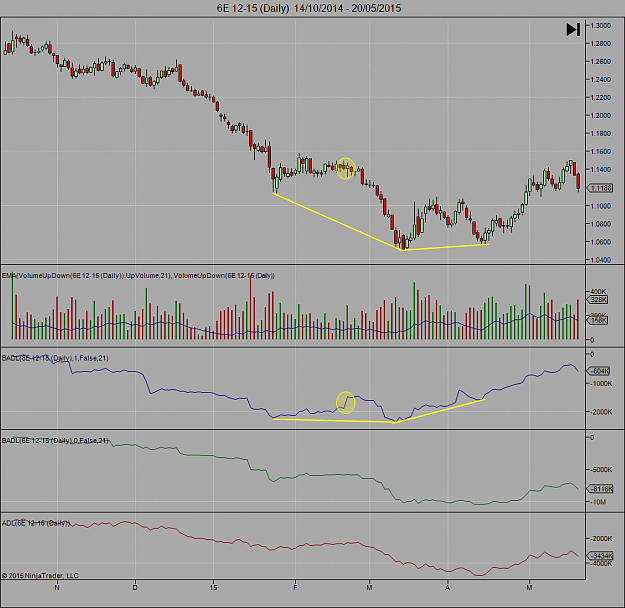
- NorthTrader replied Sep 17, 2015
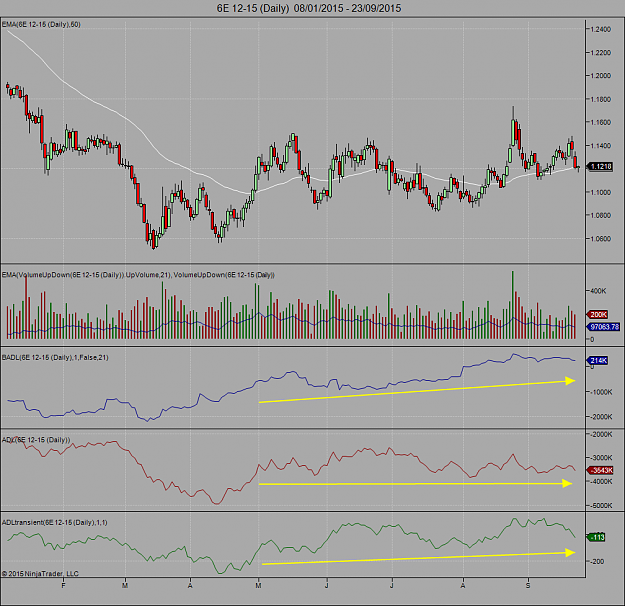
EUR.USD Daily Reversal So does the BADL ever diverge from price to predict a reversal? Here is the same 6E daily chart but shifted to the left to show the start of the reversal from 1.05. You can see that the first yellow line is much steeper on the ...
Better ADL
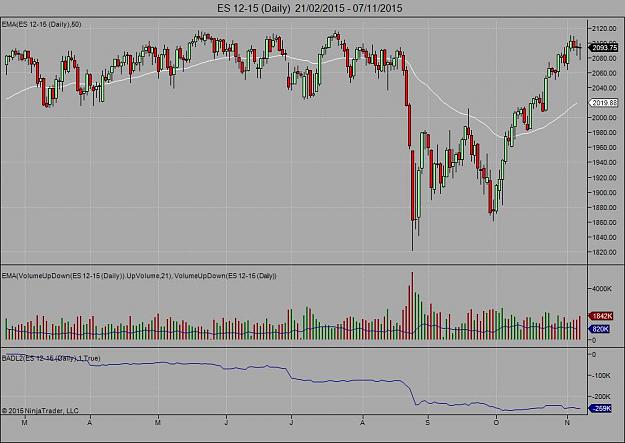
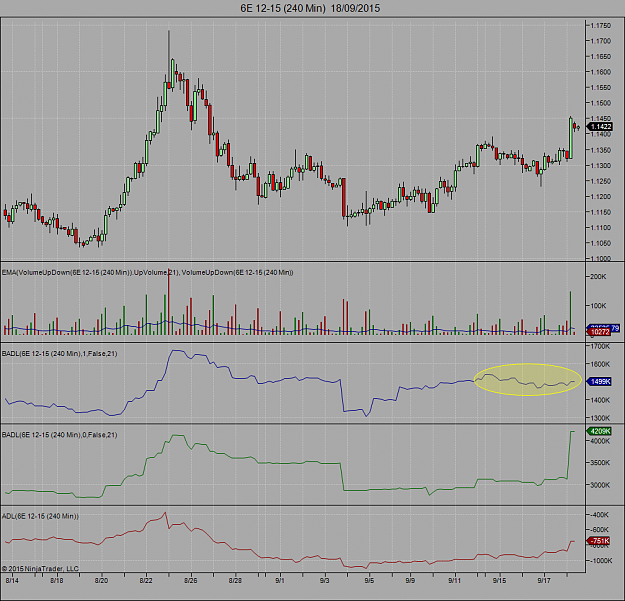
- NorthTrader replied Sep 16, 2015
EUR.USD Daily Here is a chart of the CME 6E contract (EUR.USD) showing the original ADL and two versions of the Better ADL (BADL). The bottom red line is original ADL. The middle green line is BADL calulating on the daily bars. The top blue line is ...
Better ADL
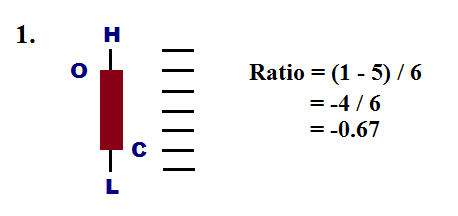
- NorthTrader replied Sep 12, 2015
Original ADL Before we can start creating a better indicator we have to know exactly what the existing ADL calculates and what we can improve. So, this is the formula for Marc Chaikin's ADL: ADL = Previous ADL + (((Close - Low) - (High - Close)) / ...
Better ADL
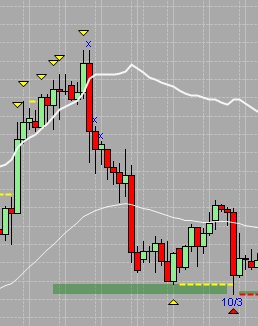
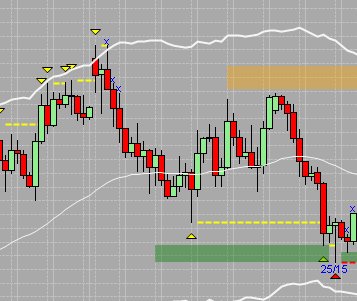
- NorthTrader replied Aug 19, 2015
Got stopped out at 1.1050 following the CPI news. Currently flat. I think it might go a bit higher now so waiting for a better price to short. Actually the daily was starting to look bullish to me before the news (shown below), and CPI helped ...
EURUSD
- NorthTrader replied May 31, 2015
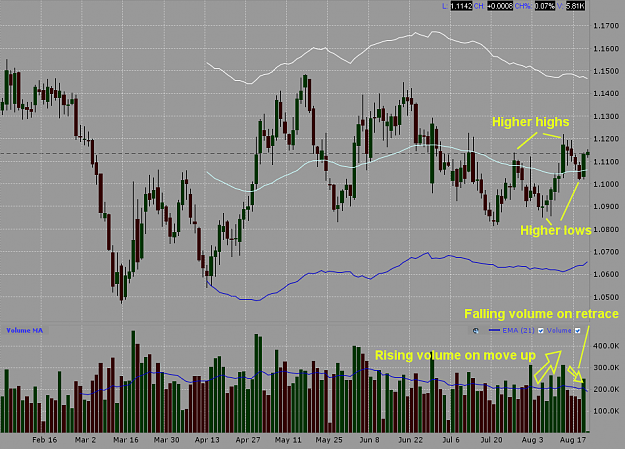
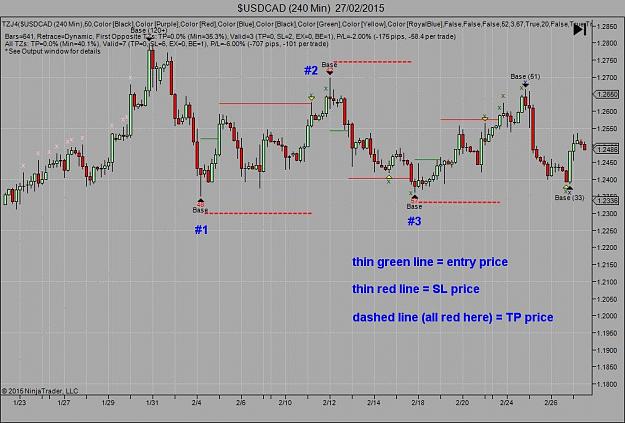
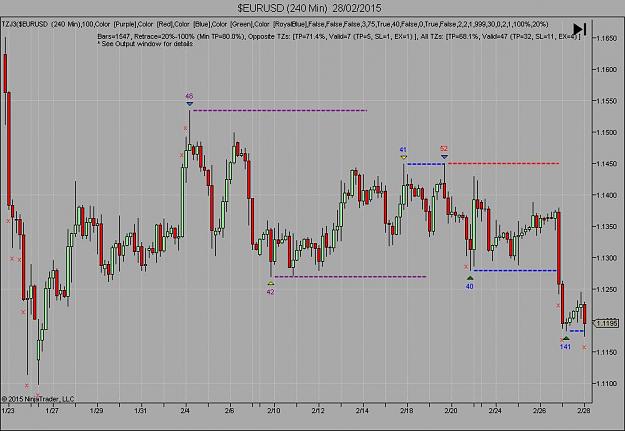
Looking back at USD.CAD, it's not difficult to find the first problem area. Since the start of this year, there have been 7 setups on M240 according to how I've optimised the parameters. Out of those 7: TP=0, SL=6, BE=1, EX=0. Ouch! That's a 6% ...
Statistical Analysis of TZs
- NorthTrader replied Apr 25, 2015
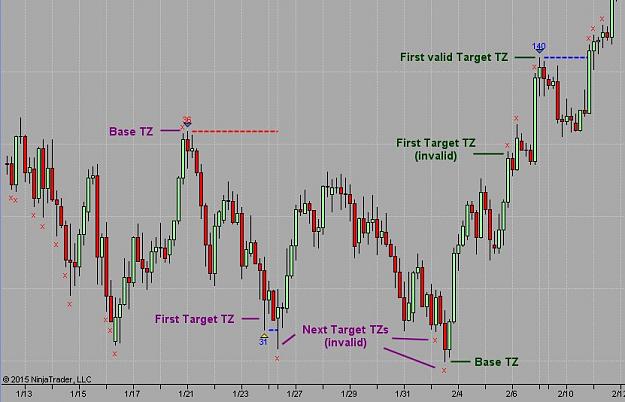
Code tweaking and testing has now finished and as a result there are two new parameters: Target h Right The number of bars to the right of the Target TZ within which the TP or SL may be hit. If neither are hit within these bars, it's reported as an ...
Statistical Analysis of TZs
- NorthTrader replied Apr 18, 2015
I'm back! Sorry for the delay. My non-trading business is unnaturally busy at the moment, so there might be lengthy gaps between posts. So, just to recap, we'd found that there was a high probability of the first opposite PTZ being resolved, for a ...
Statistical Analysis of TZs
- NorthTrader replied Apr 15, 2015
Thanks Sis.yphus. I think Dochian channels are good for this purpose but limited by the fact that you're stuck with only one h value, for example h=20 on the chart you posted, without continuously changing the period to math the conditions. A ...
Statistical Analysis of TZs
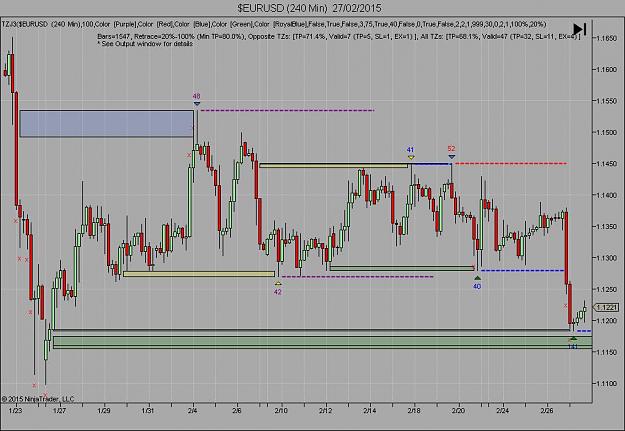
- NorthTrader replied Apr 13, 2015
Thank you for your support everyone
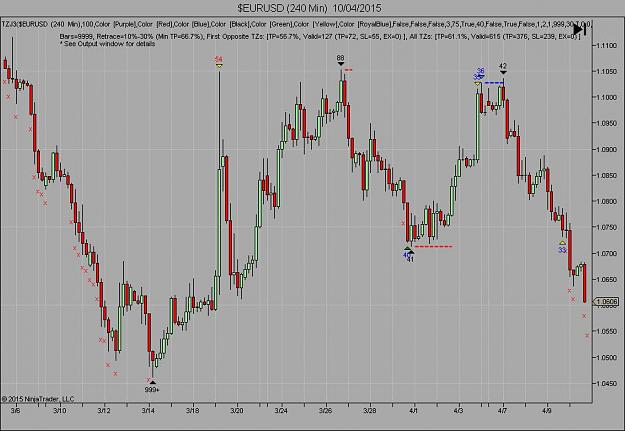
Statistical Analysis of TZs So, just to recap, we are testing the theory that when you have a PTZ on the chart for a certain h value, and an opposite PTZ appears for the same h value, then the probability of the second PTZ being resolved ...
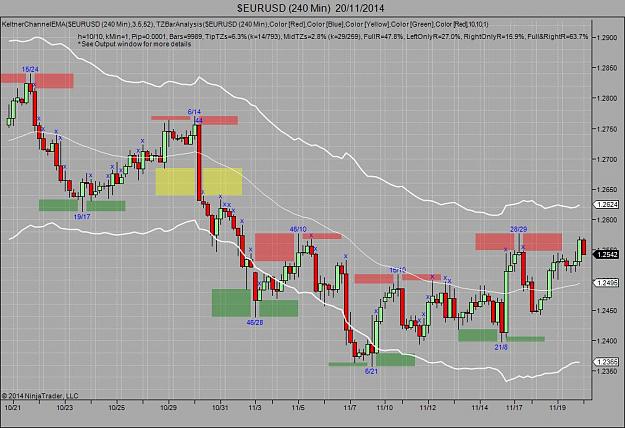
- NorthTrader replied Nov 23, 2014
Hi everyone, For anyone using Ninjatrader, I've just made a small enhancement to my TZBarAnalysis indicator. I realized that with low h values the top and bottom Tip TZs were hard to differentiate on the chart, so I've made the two zones separate ...
Transient Zones - Basics