- Search Crypto Craft
- 51 Results
-
 Nik-Nyc replied Aug 4, 2021
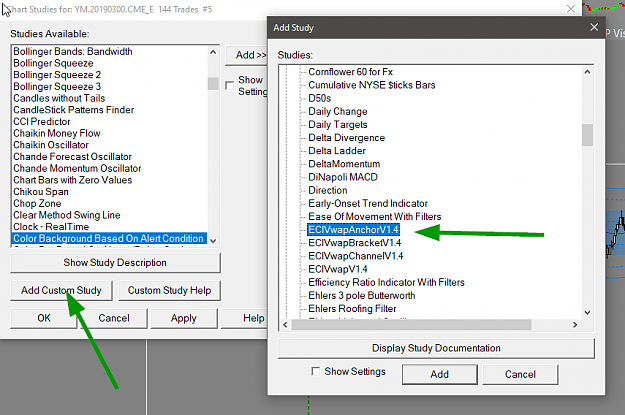
Capstone, Find attached the link to the study collection with alert you requested. (FF wont let me attach the Sierra file type) Download and place file in your data folder, then load the study collection via Analysis menu. Best, N url image
Cutting the cord with M1 scalps
- Nik-Nyc replied Feb 15, 2019
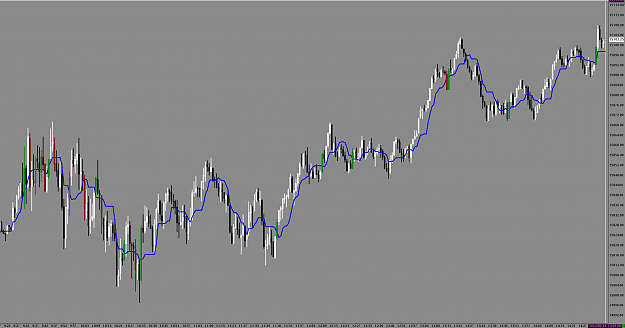
Weird . . . definitely should work with some settings tweaking. Perhaps sierra support board is required. Anchored vwap, check below. image (after attaching, right click to anchor . . .also, no playing around with all the other user created ...
Plan the Trade
- Nik-Nyc replied Sep 26, 2018
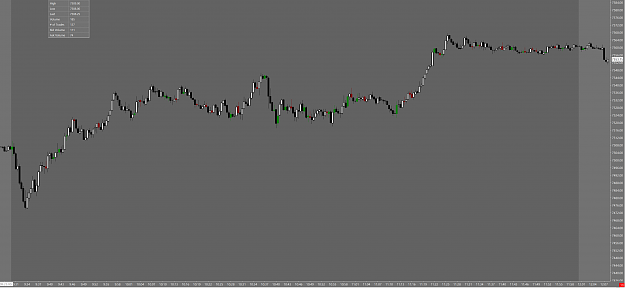
Working on a 2.0 version of the orderflow s/d candle study . . . will share once complete . . . in the meantime, these are today's OF candles. NQ 30 Sec 9-26 image Edit: Thank you Ozz
Plan the Trade
- Nik-Nyc replied Sep 24, 2018
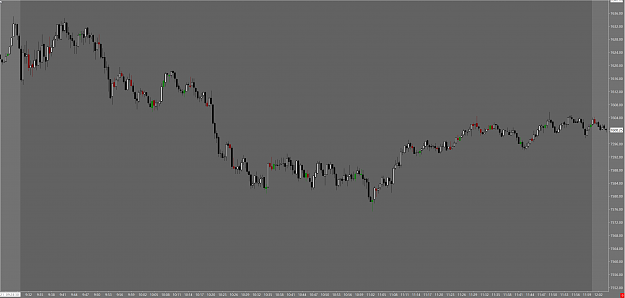
Theunis, I recommend you either look for S/D via the thrust bar method, or the green/red candle. Either, or, not both. The good thing about the green/red bars is they are non subjective and will make back-testing more accurate. Today's PA with ...
Plan the Trade
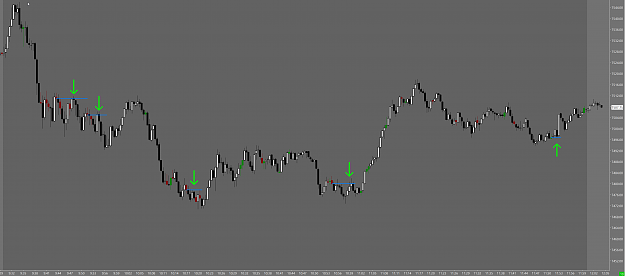
- Nik-Nyc replied Sep 20, 2018
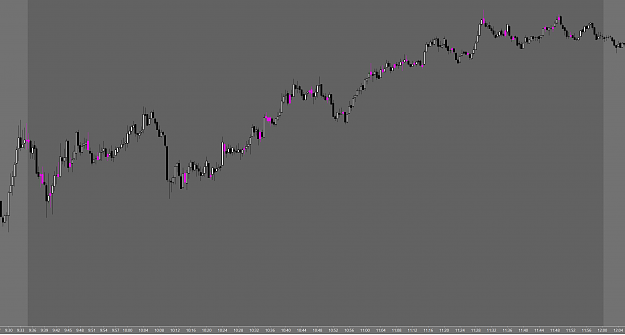
Nq - 30sec - 9/20 - Orderflow Supply & Demand Candles highlighted. image
Plan the Trade
- Nik-Nyc replied Sep 19, 2018
My understanding of what Harold has shared and taught in this thread centers around simple PA patterns like the 123 and 2B on the most immediate micro scale, as well as the concept of S/D. The PA patterns printed by the candles are (mostly) ...
Plan the Trade
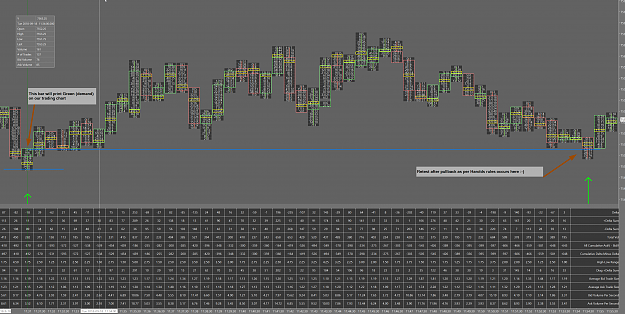
- Nik-Nyc replied Sep 19, 2018
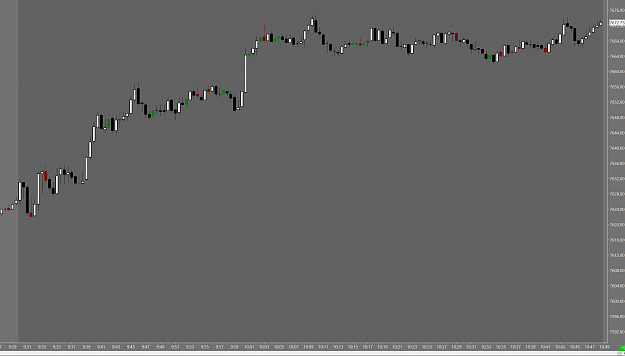
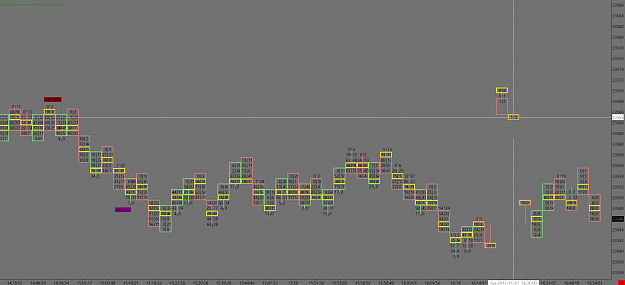
NQ - 30Sec - 930am Est to 12pm highlighted - 9/18 You guys are all correct . . . Green and Red candles are S/D that are calculated and therefore consistently applied, zero discretion, only math. More to follow as time permits. image
Plan the Trade
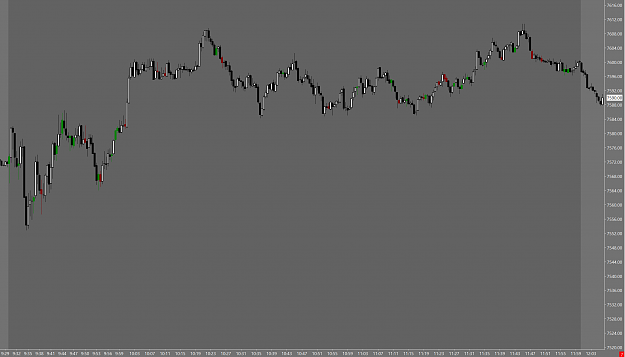
- Nik-Nyc replied Sep 18, 2018
Little preview . . . will markup the chart with proper explanation in next few days. In the meantime, note the Green and RED bars and ask yourself what might they represent? When a swing begins with a Green/Red candle what might that mean? Also ...
Plan the Trade
- Nik-Nyc replied Jan 15, 2018
Thanks HG. I will gladly post more examples tomorrow once the markets opens back up. The great thing about absorption is that it occurs every day and on every market, so examples are easy to find (and trade). Also, i noticed the discussion on ...
vsa with Malcolm
- Nik-Nyc replied Jan 15, 2018
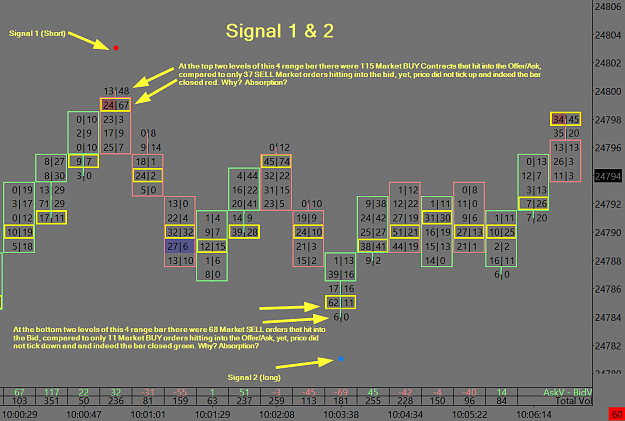
Hi Silence, As per usual HG explanation was excellent. Attached is a chart previously marked up and posted in another thread, it may offer some additional insight into the concept of absorption. Besides the bid/offer market orders represented in the ...
vsa with Malcolm

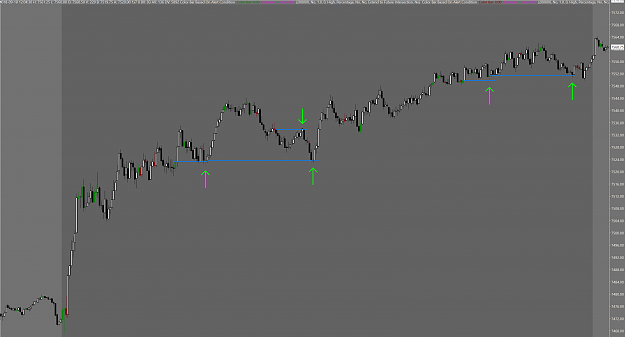
- Nik-Nyc replied Dec 19, 2017
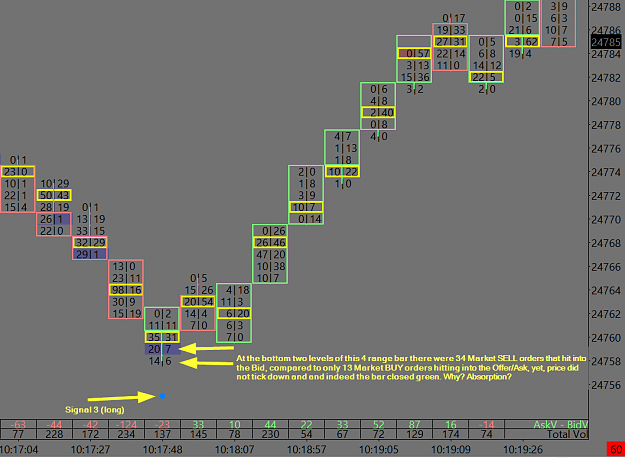
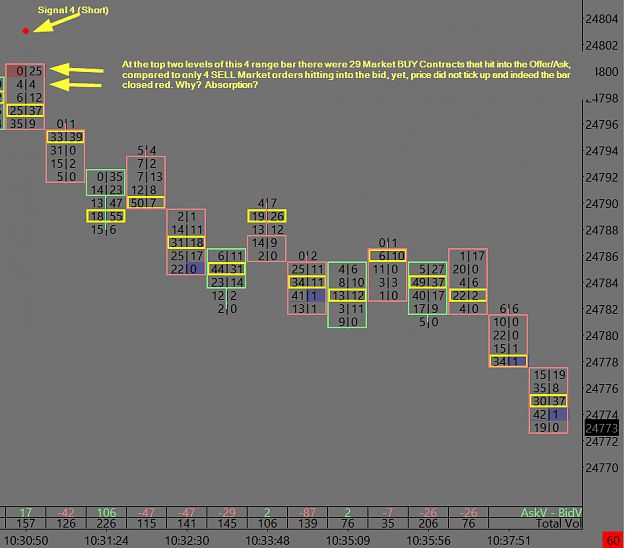
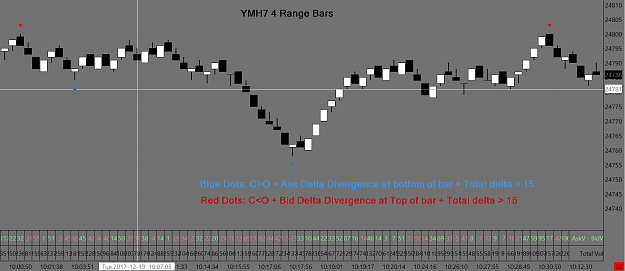
DonPato, Posting the same chart with signals as above, as well as zoomed view of each signal with and internal view of the BID vs ASK/OFFER bars at each level. Hopefully this will help illustrate the point i am trying to make. At the bottom of the ...
Hey...what about Volume?

- Nik-Nyc replied Dec 19, 2017
I use absorption and mini-absorption as the final trigger in my trading . . . very high % of trades will reach BE, many trades will earn high RR profits, and few trades will hit initial SL. Busy with holiday, family, travel, but should you want to ...
Hey...what about Volume?
- Nik-Nyc replied Nov 28, 2017
1597T chart, ABCD completion happened at the 161.8ext with harmonic confluence. No signal candle to short at the 127.2ext. The 138.2 was trickier with the pinbar/doji. Looking forward to live stream tomorrow
Ratios & Harmonics: a Different Way to Trade . N image
- Nik-Nyc replied Nov 28, 2017
Hey Mil, I also had a long trade on the 233T at 634 and got taken out at +1 by a tick . . . i managed it aggressively given the multiple abcd and 1:1 completions we were approaching. On the 1597T this is what i am watching: N image
Ratios & Harmonics: a Different Way to Trade
- Nik-Nyc replied Nov 21, 2017
Noticed this as well . . . from what i can see from the DOM/Orderbook replay, it appears to be a liquidity gap, essentially all limit orders got pulled and price behaved erratically. I wanted to double check it was not a massive order going off at ...
Ratios & Harmonics: a Different Way to Trade
- Nik-Nyc replied Nov 10, 2017
Csternfx, Seems you have answered your own question
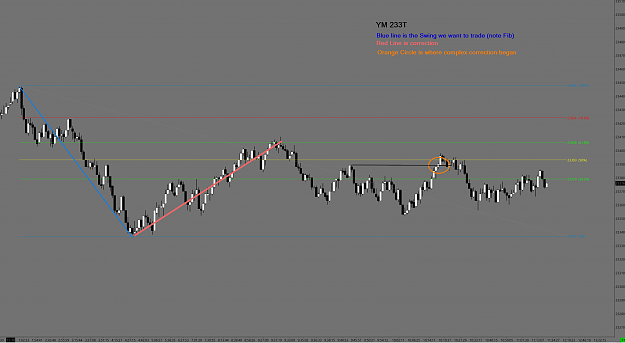
Ratios & Harmonics: a Different Way to Trade. Usually, Damian's first chart will have a fib drawn which will help you identify the swing he intends to trade. Once you know the main swing, everything else makes sense, including complex ...
- Nik-Nyc replied Nov 4, 2017
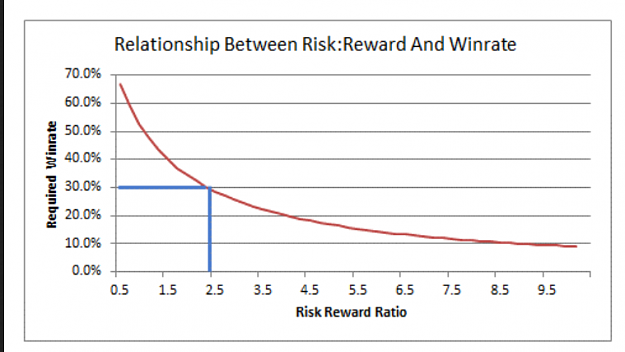
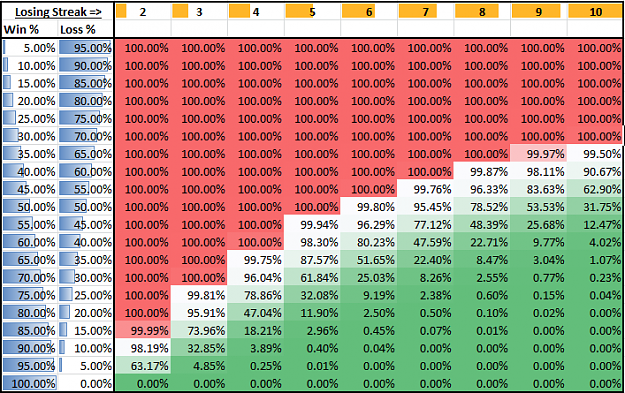
Sorry, but the excel you posted proves nothing, zero. I highly recommend you have a good read on the following two subtopics within Money Management: 1) Max Drawdown 2) Trading Costs Since you like pics, i have included two to get you started. Lots ...
Trading Made Simple