- Search Crypto Craft
- 2,523 Results
-
 Nala66 replied 1 hr 41 min ago
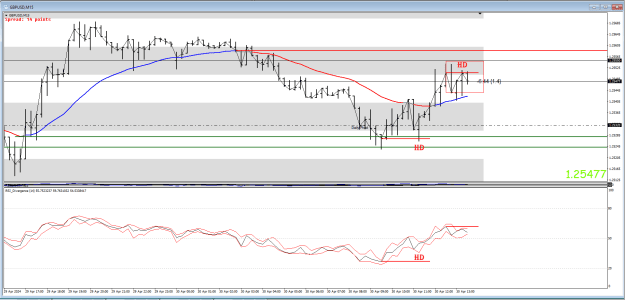
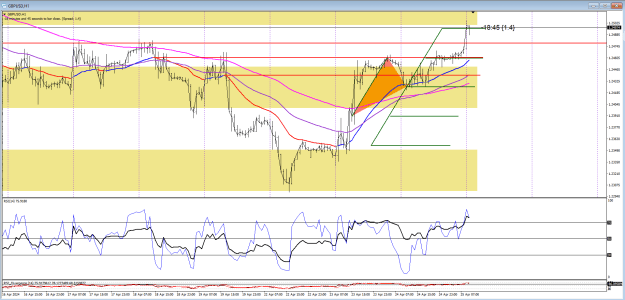
This bear div on the 1H should send price back to the EMA but the bears are struggling so watch out for the HH. image When struggles are on like this better to sit on hands for a tad.
Trading the Cable swings via averages
- Nala66 replied 24 hr ago
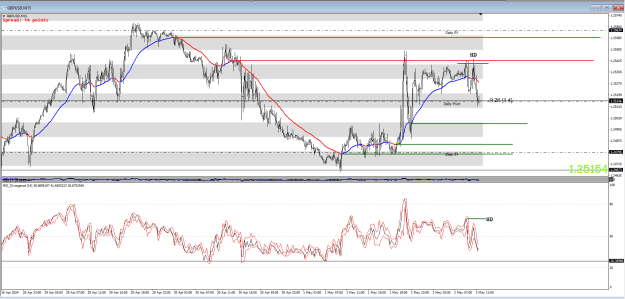
Hope everyone is on the bear HD... image I bailed out at the daily pivot because I got a visitor.
Trading the Cable swings via averages
- Nala66 replied 27 hr ago
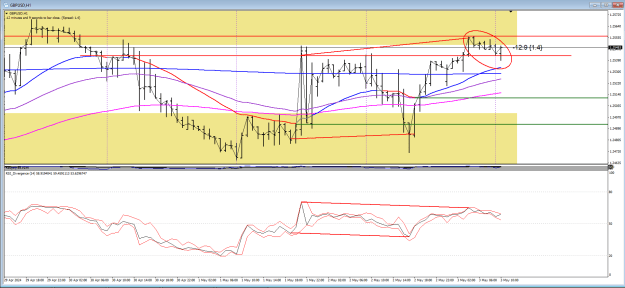
I only traded this bit yesterday. In the red circle. image The big move came whilst I was sleeping.
Trading the Cable swings via averages
- Nala66 replied Apr 30, 2024
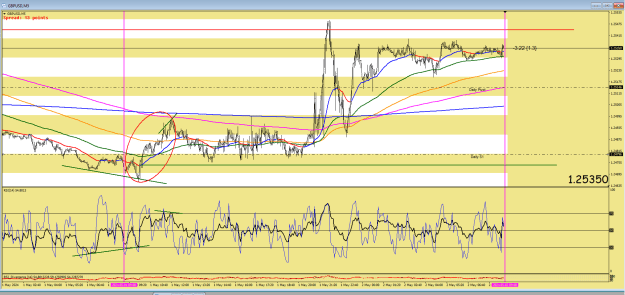
The tick chart is barely moving, not much interest. Price is bouncing off the C of the ABCD image
Trading the Cable swings via averages
- Nala66 replied Apr 30, 2024
I can't draw fast enough to keep up... image
Trading the Cable swings via averages
- Nala66 replied Apr 30, 2024
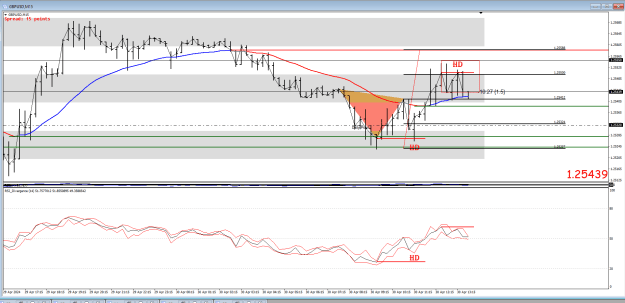
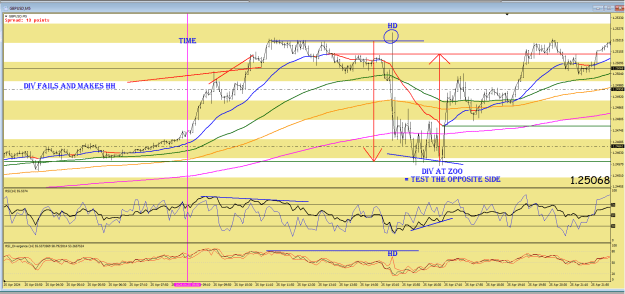
Check out the short term 15-min... image A hidden div at the ZOO point.
Trading the Cable swings via averages
- Nala66 replied Apr 30, 2024
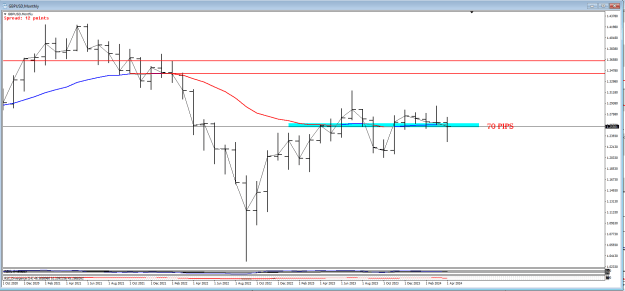
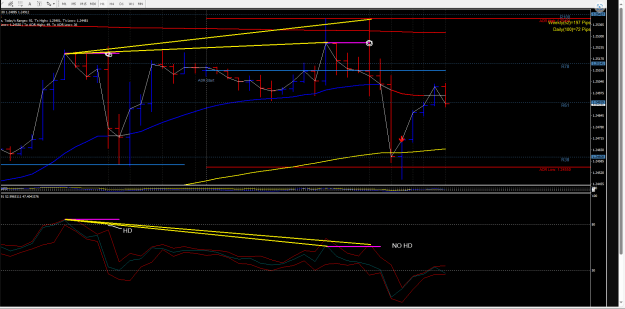
Just take a look at the monthly and despite all the swings up and down the market has kept the average in a 70-pip range. This has been going on for months now. When is it going to break out? image
Trading the Cable swings via averages
- Nala66 replied Apr 30, 2024
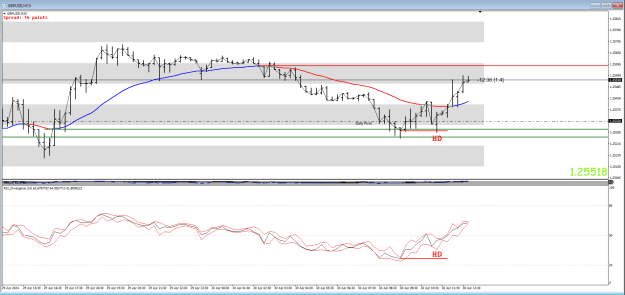
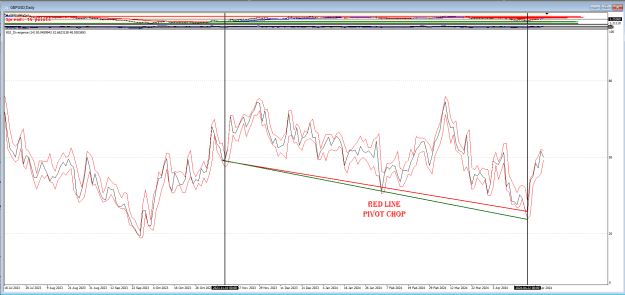
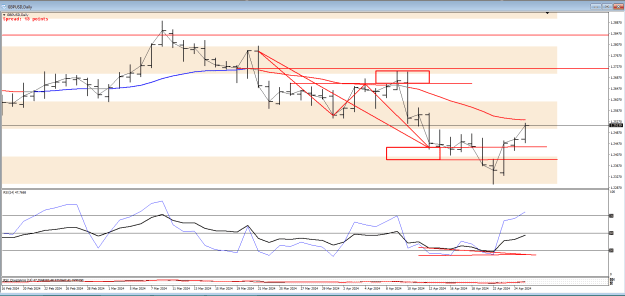
Back to the use of hidden divergence... Here on the daily we have the red line, but it has chopped into the pivot shown so that cannot be divergence. But look at the green line it just made it past the pivot when according to the history of the RSI ...
Trading the Cable swings via averages
- Nala66 replied Apr 27, 2024
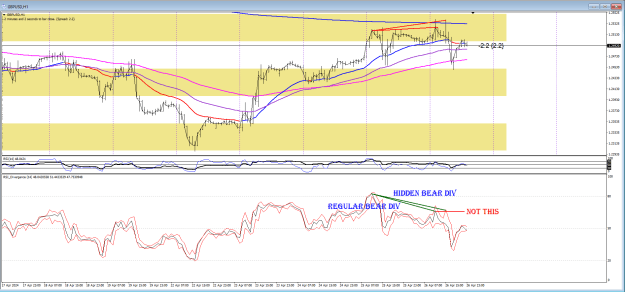
Kerrect (not) The first one was HD., you had no problem with that. The second one was in regular bear div but it failed (expect a HH). Look what happened with that expected HH. It ran into a bear HD. image Let me explain this a little.... This RSI ...
Trading the Cable swings via averages
- Nala66 replied Apr 25, 2024
Couple of things to point out here for your edification (nice word). And yes, you are getting good at this. image
Trading the Cable swings via averages
- Nala66 replied Apr 25, 2024
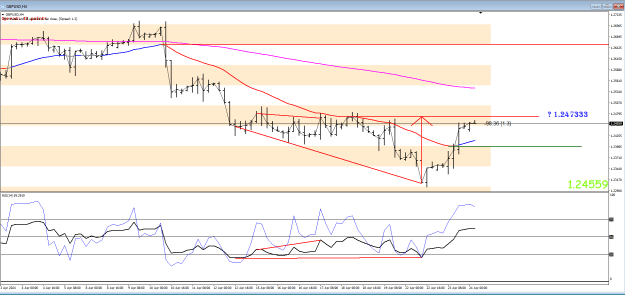
Not sure about the going back on the bounce. To me that is in the lap of the gods. Here is the daily AB=CD for those who don't understand... image Note the only div that counted was after the target was hit.
Trading the Cable swings via averages
- Nala66 replied Apr 25, 2024
Made the 1-hour ABCD now what? image Have to wait a tad and see what sets up.
Trading the Cable swings via averages
- Nala66 replied Apr 25, 2024
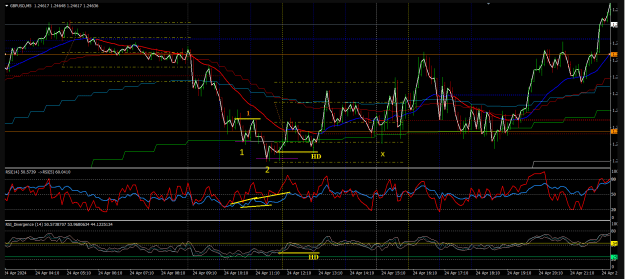
Another bad day, another loss. Here is how i trade yesteday image I'm busy yesterday so i miss our trade time, price is too near EMA H1 So my first order is at 1, i buy due to M5 DIV bull and got stoploss I re-entry at 2, my target is 2454, the ...
Trading the Cable swings via averages
- Nala66 replied Apr 24, 2024
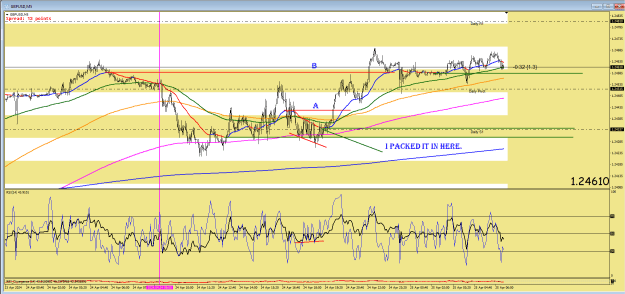
For those still trying to get a handle on this... For the average to pass A the price should reach B on this 5-min chart. image This is my main trading method. Hence trading the average swing levels.
Trading the Cable swings via averages
- Nala66 replied Apr 24, 2024
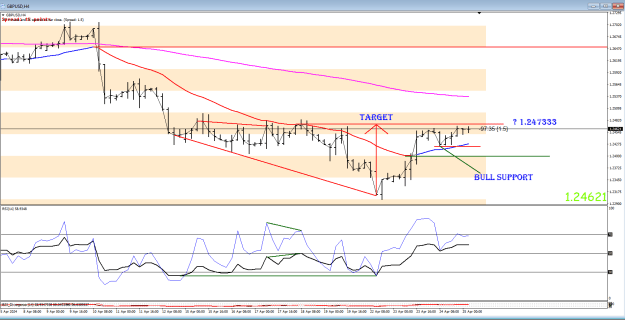
Well overnight I see the4-hour has found support and is still on track to the target level... image I only made a total of 23 pips yesterday. It was so slow. After a slow market day, I am always wary that a bigger move is in the making.
Trading the Cable swings via averages
- Nala66 replied Apr 24, 2024
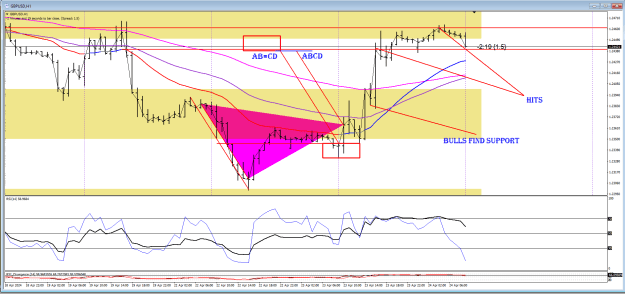
Yep, there was quite a bit going on with the 1-hourchart yesterday which I didn't pick up on... Both the ABCD and the AB=CD were the same target level image
Trading the Cable swings via averages
- Nala66 replied Apr 23, 2024
This is what I was looking at before going to sleep last night on the 4-hour chart. image I was expecting to see the target hit by now, however maybe it needs more time.
Trading the Cable swings via averages
- Nala66 replied Apr 23, 2024
Gee that push was 1 pip off my TP but I have closed now anyway. Whoops no it wasn't my red line was a tad too high. image Note how the EMA is trying to break the red line level that price reaches the next red line level.
Trading the Cable swings via averages
- Nala66 replied Apr 23, 2024
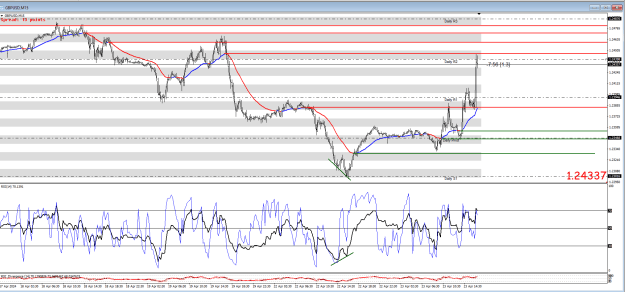
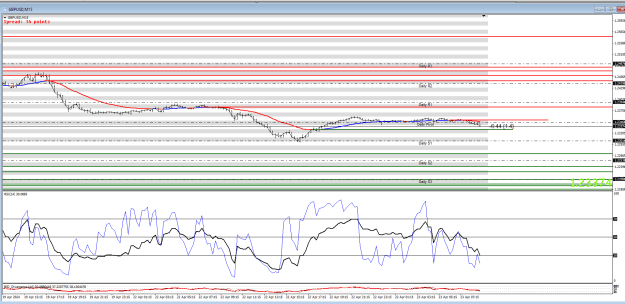
The daily pivots such as the S1 S2 etc are supplied by your broker in the tool list. Mine is called Auto Pivots. I then remove the ones I am not interested in. I am at a loss to understand why you cannot see targets for today. Look at the15-min ...
Trading the Cable swings via averages
- Nala66 replied Apr 22, 2024
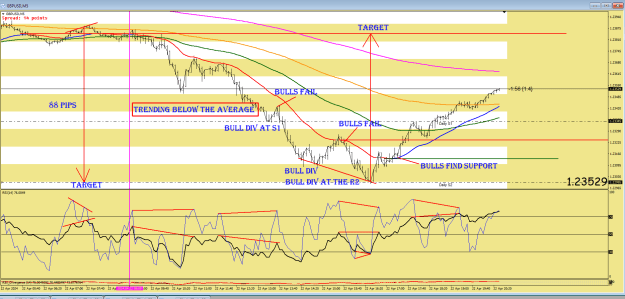
Here is the workings of the 5-min chart today... image If you cannot get the required pips from this then you are doing something wrong.
Trading the Cable swings via averages