- Search Crypto Craft
- 261 Results
- Mpt replied Jun 7, 2018
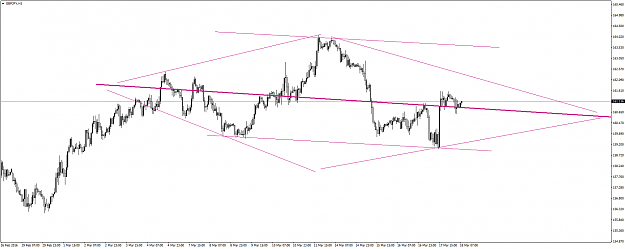
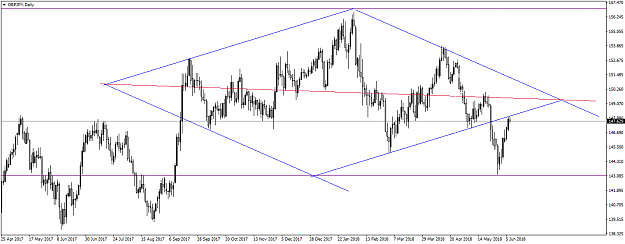
For what it's worth...This is why I stated a week or so ago that I expected top circa 147.5/148. A fairly long term (daily) diamond structure with a centre about 150x. Predictable as per a bounce from the lower apex, predictable with respect to ...
Dragon Riders GBP/JPY
- Mpt replied Apr 10, 2018
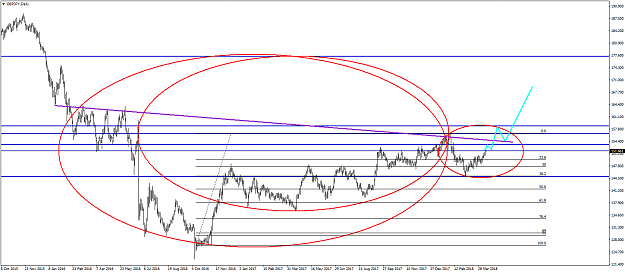
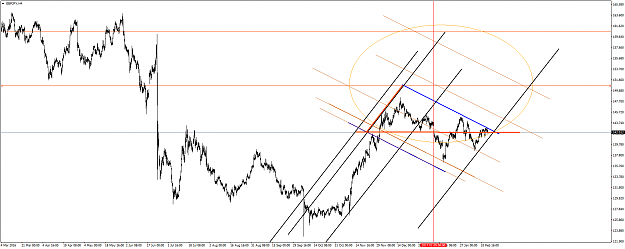
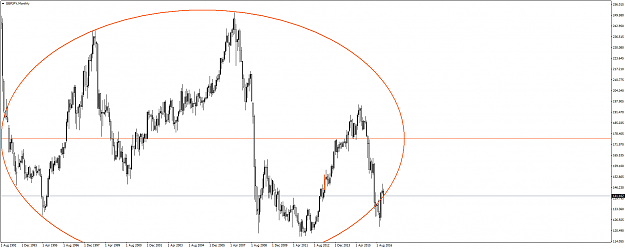
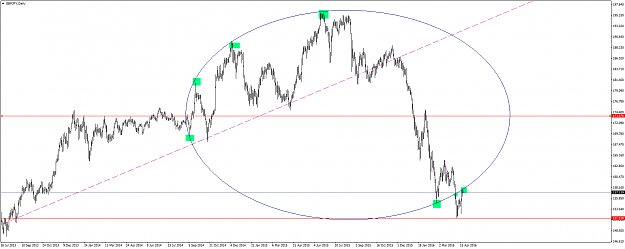
image Can only draw elipses. Cup/handle structure. Handle retraced 38%. Currently at 50% up the cup formation. Any break up possibly follows blue line. Failure means broader cup. Break up should eventually retest falling line after rising to ...
Dragon Riders GBP/JPY
- Mpt replied Jan 24, 2017
In or out? Still line ball. Even after 25 years no one knows if it's bullish or bearish. image
Dragon Riders GBP/JPY
- Mpt replied Jan 10, 2017
I didn't post this, nor comment at the time as I really was unsure. One of the very very few wave trades that work out are for end of wave 4 when three parameters are met. Wave 4 moves into wave 5 which is the last and final wave. Wave 5 is usually ...
Dragon Riders GBP/JPY
- Mpt replied Dec 10, 2016
I happen to agree with you. IMHO, we are not seeing a correction. We are seeing a total re-positioning of the USD (and by default the USDJPY aka USD/USD) with the Pound to start shortly. Call it a C wave if you will. Thirty plus years of balderdash ...
Dragon Riders GBP/JPY
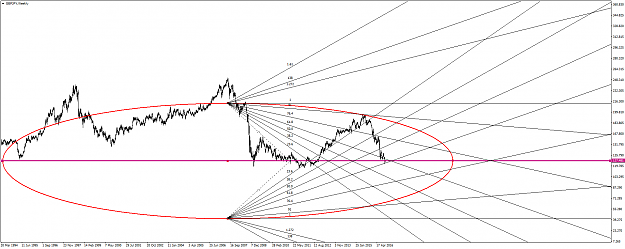
- Mpt replied Oct 20, 2016
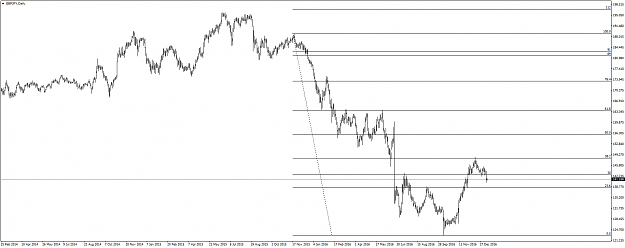
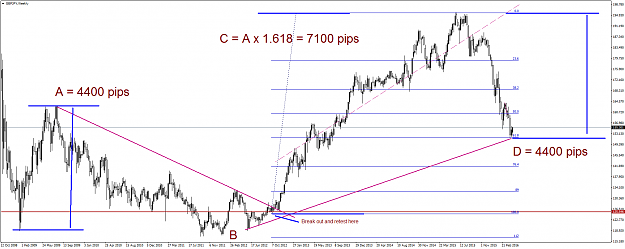
Pretty much how I did the measurements and guesstimations for GU in the Brexit case. Fib fans referenced to obvious centre of structure, against the largest centre spike, being Feb 2011. No use to anyone who only trades on lower TF than daily image
Dragon Riders GBP/JPY
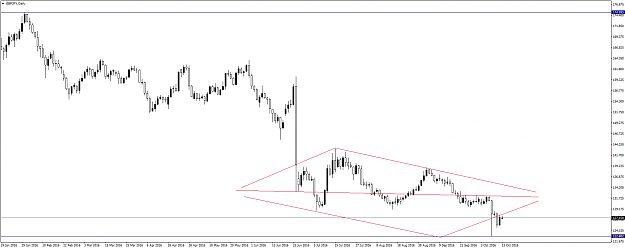
- Mpt replied Oct 12, 2016
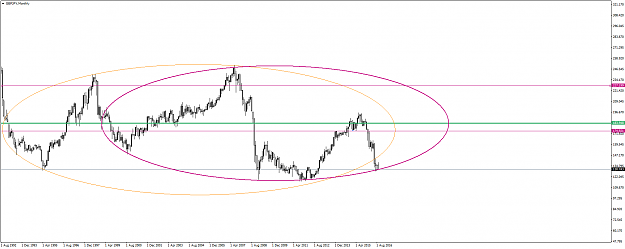
Well, looking at the entire mess since the Brexit fall, most people were of the opinion that price was in a 5 wave triangle. The overall complexity and, indeed, internal structure never supported that view. The 131.5/132 area was always a complete ...
Dragon Riders GBP/JPY
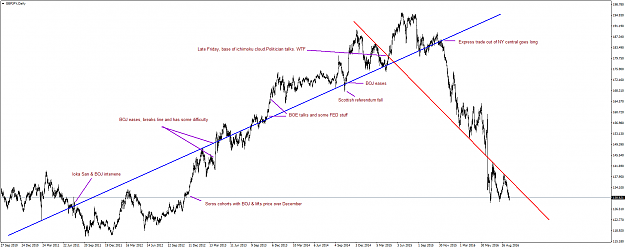
- Mpt replied Sep 26, 2016
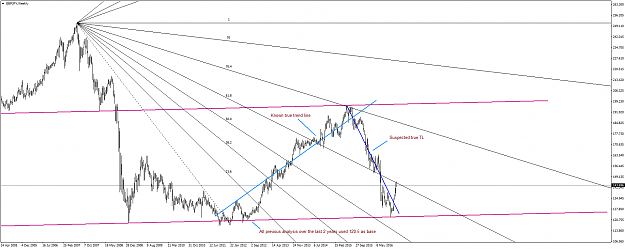
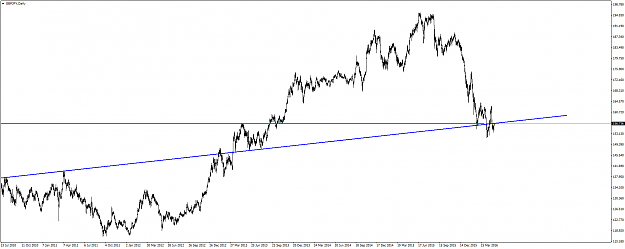
As some folks are aware, I've never been overly fond of so-called trend lines. I used to update the blue line every year or two, but haven't done so since 2015. The red falling line appears to have some merit. image
Dragon Riders GBP/JPY
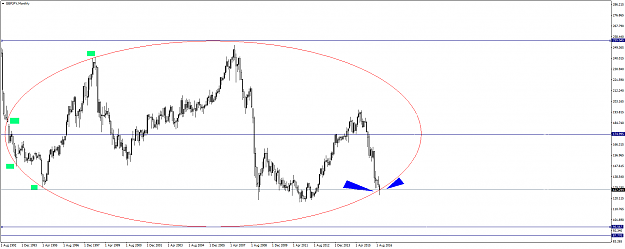
- Mpt replied Sep 23, 2016
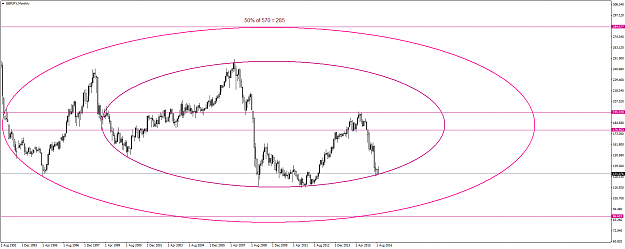
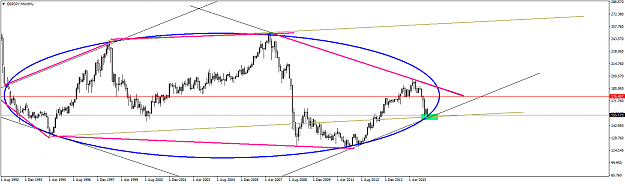
Multi yr chart re-posted with slight variations. I repeat the mantra that this chart may be displaying a setup that offers one of the most significant trading opportunities since the fall out of 570 entered a corrective phase in Sep 1992. image
Dragon Riders GBP/JPY
- Mpt replied Jun 16, 2016
Is this a more recent photo of you wearing a hat? image
Dragon Riders GBP/JPY

- Mpt replied Jun 2, 2016
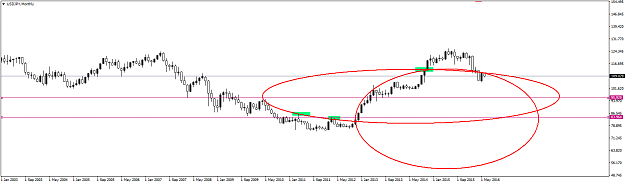
Yes, the Yen. Conventional wisdom is that it will fall only a little more before coming back to break 111. However, under 107, it eventually breaks 104, and is running about 3-4 months behind Sterling Yen. In that regard, it would arrive in about ...
Dragon Riders GBP/JPY
- Mpt replied May 10, 2016
Last time broken by BOJ in their first 'easing' image
Dragon Riders GBP/JPY
- Mpt replied May 9, 2016
Quoting lancedes Please would you explain in a bit more detail what you mean by this? Thanks in advance. In October 2015, when the pair was at 185, a chap from Morgan Stanley said that it was the most overvalued pair in forex. He expects it to dive ...
Dragon Riders GBP/JPY
- Mpt replied Apr 21, 2016
Reckon this is precisely the place to get up from, or fail. And a casual minor new high/non-sustaining spike would do it. I'll post a diagrammatic representation to explain why in a few minutes. image
Dragon Riders GBP/JPY
- Mpt replied Mar 18, 2016
Bullish/bearish? Pretty much right on the line. image
Dragon Riders GBP/JPY