- Search Crypto Craft
- 26 Results
-
 Lunartrader9 replied Oct 9, 2022
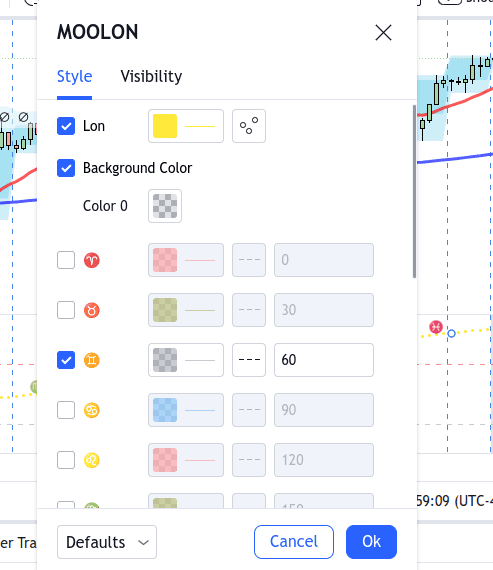
I show you my settings in post # 12902 image Just copy them. You have the horizontal line for sag and gemini as thick and colored. Just make them thin and dotted like mine.
Planetary Cycles Trading (EUR/USD)
- Lunartrader9 replied Oct 9, 2022
Yes...you have the indicator on the price chart. It should be in it's own window below the chart. So.....put your cursor on one of the astrological symbols on the indicator an it will give you a hand symbol. Right click and you will see the ...
Planetary Cycles Trading (EUR/USD)
- Lunartrader9 replied Oct 9, 2022
I just have all the other zodiac signs unchecked. image
Planetary Cycles Trading (EUR/USD)
- Lunartrader9 replied Oct 8, 2022
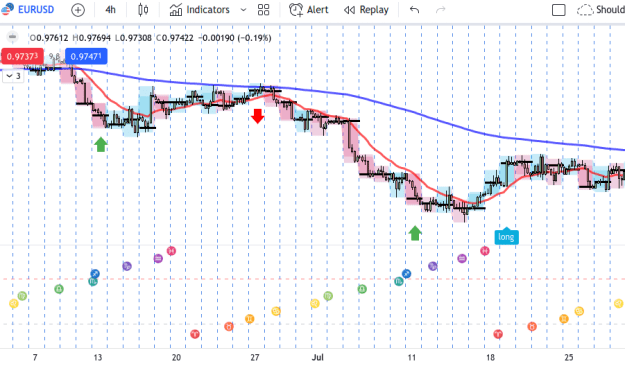
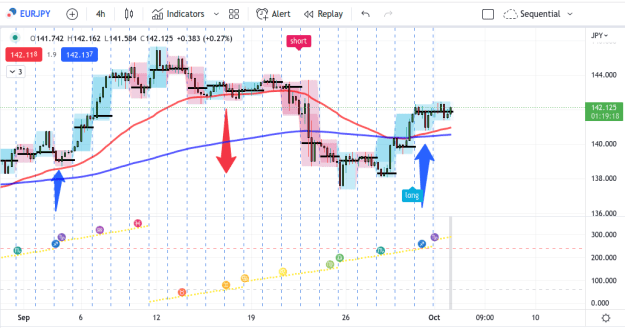
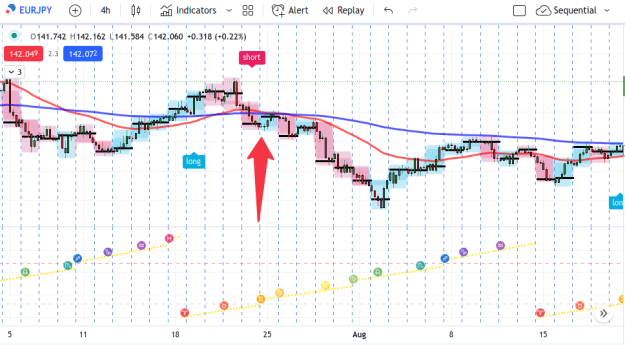
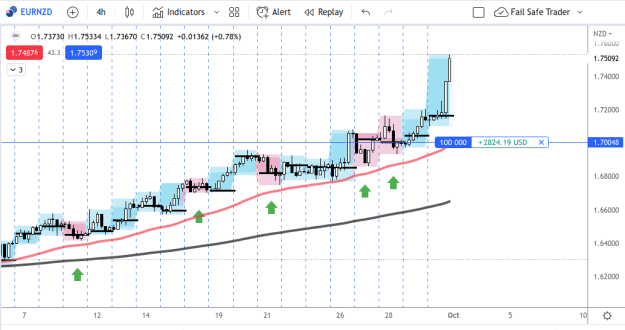
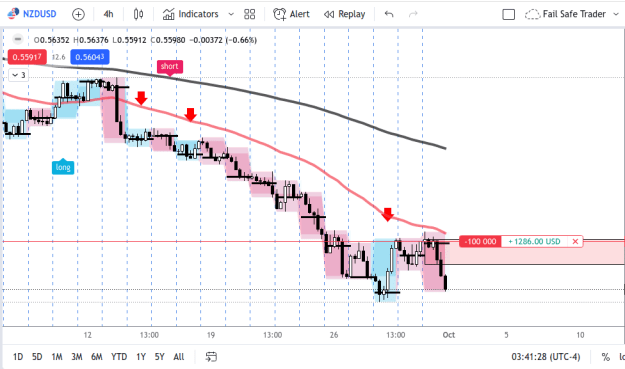
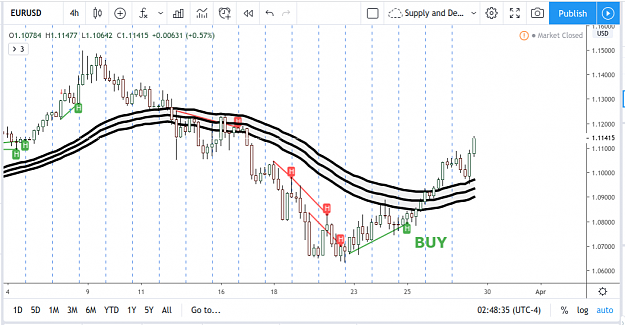
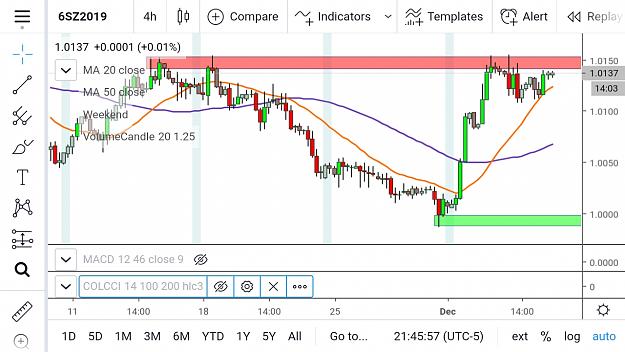
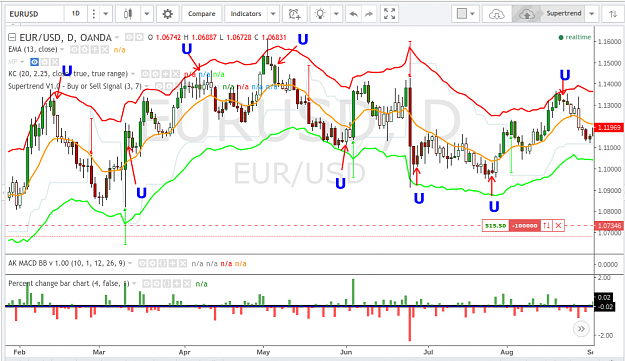
Very simple way to trade Euro using moon cycles. Buy moon in Saggitarius. Sell moon in Gemini. image
Planetary Cycles Trading (EUR/USD)
- Lunartrader9 replied Oct 3, 2022
There is really a simple way to use astrology that is very effective. Buy when Moon is in Sagittarius when in uptrend (50 ma above 200 ma) and price has pulled back. Sell when moon is in Gemini when in downtrend (50 ma below 200 ma) and price has ...
Planetary cycles, astrological theory of cycles of the markets
- Lunartrader9 replied Mar 28, 2020
I made 1400 pips this week.....no stop losses. I started making money when I stopped using stops. image
Trading with no stop loss
- Lunartrader9 replied Dec 5, 2019
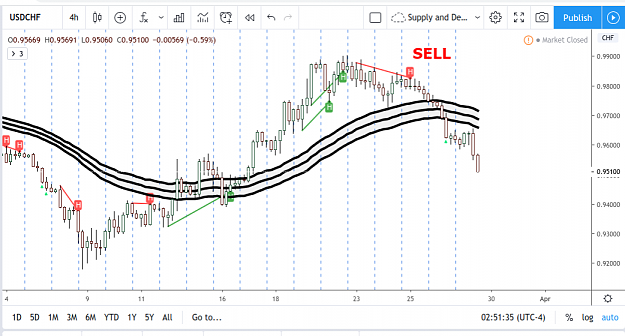
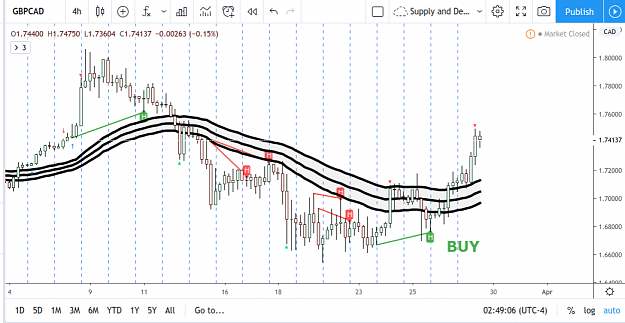
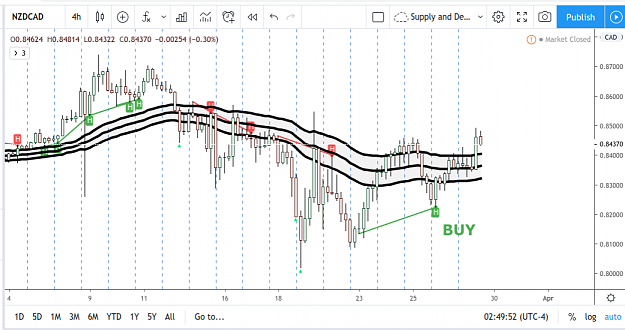
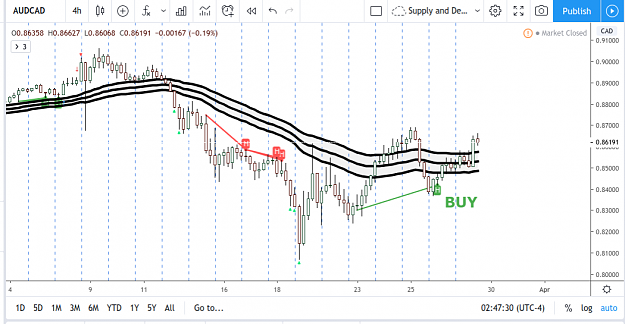
Learn how to read Supply and Demand zones. Where the banks and institutions are unloading their inventory.
has anyone EVER seen a successful trader/trading system?
- Lunartrader9 replied Feb 17, 2019
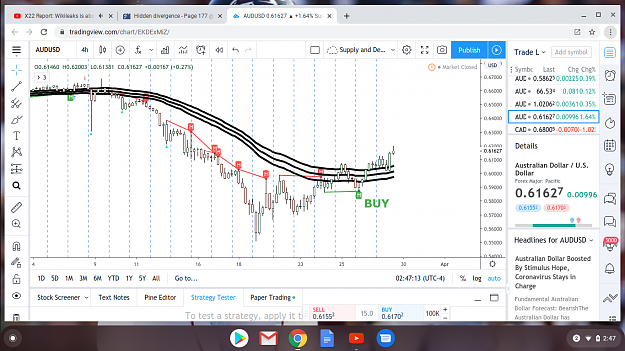
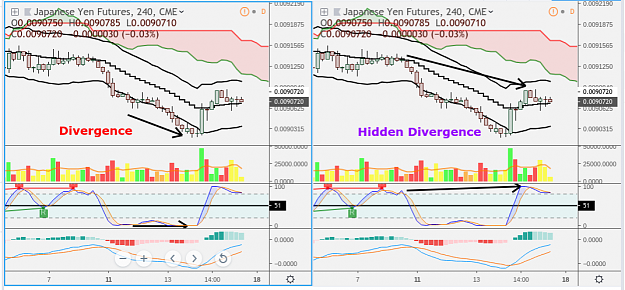
Have others noticed that a Divergencre signal will lead to a Hidden Divergence on the next pivot many times? And I think the reverse is true too. A Hidden Divergence signal can lead to a regular Divergence signal at the next pivot.
Hidden divergence
- Lunartrader9 replied Feb 17, 2019
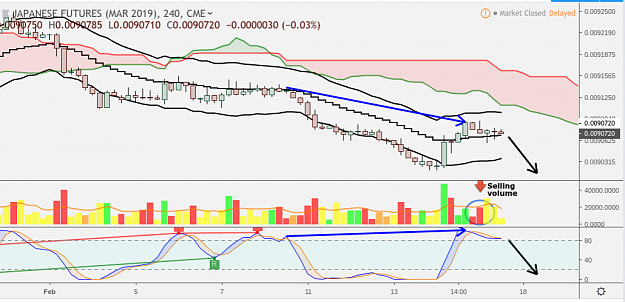
Here is Japanese Yen futures....4 hour chart. There is Hidden Bearish Divergence. Selling volume confirms the move down.
Hidden divergence
- Lunartrader9 replied Jun 2, 2017
image My first trade using this system. +$1000 I'd like to note that I have studied the TDI indicator and it's very important to make sure you go long when the red and green line are ABOVE the 50 line.....and only go short when the red and green ...
Trading Made Simple
- Lunartrader9 replied Mar 31, 2017
I just looked up Larry Pesavento and how he trades. He trades using Fibonacci ratios and pattern recognition. Neither of which has anything to do with what I do. I don't mind someone criticizing my method but be factual and accurate. What you wrote ...
Planetary Cycles Trading (EUR/USD)
- Lunartrader9 replied Mar 30, 2017
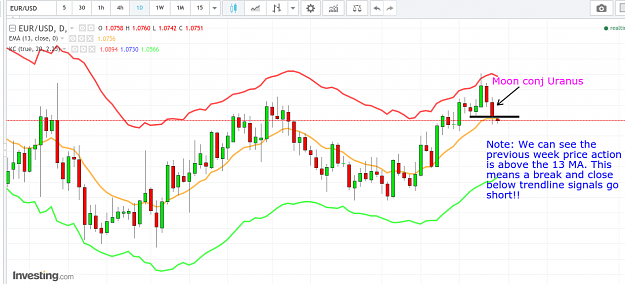
As promised, we just had the Moon/Uranus conjunction on the 29th. Here is my chart..... image
Planetary Cycles Trading (EUR/USD)
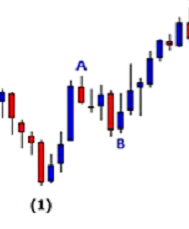
- Lunartrader9 replied Mar 22, 2017
True. But, Ketu seems to hit the longer cycle trends while Rahu seems to hit the beginnings of pullbacks within a larger trend. As an example,in the diagram below...Ketu would be (1) and B.....while Rahu would be A. image This is how I'm seeing it. ...
Planetary Cycles Trading (EUR/USD)