- Search Crypto Craft
- 241 Results
-
 JuliusCeasar replied May 31, 2011
IMO bull is back we could see 1.51 in June here is why on a weekly image
EURUSD
- JuliusCeasar replied Apr 20, 2011
Here are some daily candles Watch out for a daily closing above 1.45 (a break out of sorts) image
EURUSD
- JuliusCeasar replied Apr 20, 2011
Bullish since DECEMBER, (not a single red monthly candle since November) I don't understand the bearish bias on this thread, i guess many accounts taking hits. I'm guessing it goes above 1.51 and its hallo 1.60 image
EURUSD
- JuliusCeasar replied Apr 8, 2011
Yap I think this week was a retrace to 0.87 area after which bull continues. I took a long at 0.8735 and will hold on to it as long as it stays above .8640 on the daily. Possible target is 0.9400 in coming weeks here is why image .
EURUSD
- JuliusCeasar replied Apr 8, 2011
Here is my view on a weekly Just being aware that the week is not over until it is but if this weeks candle also closes on its highs above 1.4450 i will continue buying dips targeting 1.50 If on the flip side there is a sell off to close below 1.43 ...
EURUSD
- JuliusCeasar replied Apr 6, 2011
My bet is up Last week i was watching out for 4250 and now we are above that. This week i suspect 1.44 will print and i'm positioned long at 4180(live here) If rate goes up, 1.44 might not even hold this thing, no change might send it tumbling ...
EURUSD
- JuliusCeasar replied Apr 1, 2011
March was bullish but did not close above 4250 Bull might be done for a while On the daily below seems like 4230 might have been a good place to short yesterday (Double Top) today 4180 might be it but you never know with NFP image
EURUSD
- JuliusCeasar replied Mar 31, 2011
Here is the exact chart in question..its a monthly and the horizontal line comes in AT 1.4250 Kindly point out the "stupid line" you are talking about If you are unable to find it go seat at a corner somewhere and play with yourself. image
EURUSD

- JuliusCeasar replied Mar 31, 2011
Go back to my posts today before you start attaching labels you have no seniority to give. You gave a baseless comment with no supporting chart Again i repeat,i have been buying dips since february and for now levels i'm watching on EU are simple ...
EURUSD
- JuliusCeasar replied Mar 31, 2011
More rubbish lines on H4 which show why 4250 and 4030 are important levels as the month ends and NFP tomorrow Above 4250 bull continues, below 4030 sell On GU above 6250 buy below 5950 sell image
EURUSD

- JuliusCeasar replied Mar 31, 2011
End of the month Bias remains bullish with eyes on reaction at 4250 A close above there signals strong bull Below 4030 i switch to shorting rallies image
EURUSD
- JuliusCeasar replied Mar 24, 2011
Here is my "i knew it post" :nerd: the "before" chart posted here around london open image After image called long 4075 live here after it bounced on that rising TL
EURUSD
- JuliusCeasar replied Mar 24, 2011
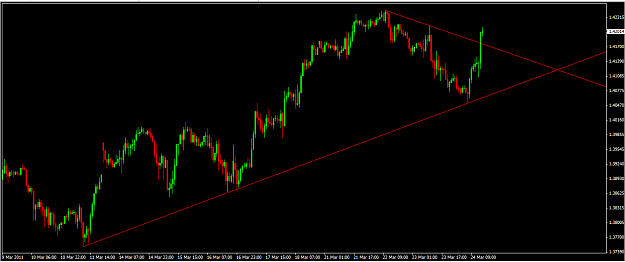
H1 chart i would not get too comfortable with shorts just yet image
EURUSD
- JuliusCeasar replied Mar 18, 2011
Weekly I suspect that falling TL might not be able to hold the bull run in coming weeks image
EURUSD
- JuliusCeasar replied Mar 17, 2011
I am no volume guru but it seems we had a buying climax with sellers coming in heavily into strength, clearer on m30 below frankie and falling tl were my other reasons for shorting 3970 image
EURUSD
- JuliusCeasar replied Mar 15, 2011
If todays candle engulfs yesterdays and slips below 3850 it might be time to consider shorts targeting 3740 ,3650, 3540 etc but not there yet image
EURUSD
- JuliusCeasar replied Mar 15, 2011
Always good to talk about the bad with the good gu long trade at 6040 will be bad if 5980-6000 does not hold as support today but i am still in it..i might short it if 1.6000 is confirmed as resistance eu still holding long from 3800 and eyeballing ...
EURUSD