- Search Crypto Craft
- 18 Results
-
 Jor09 replied Sep 5, 2008
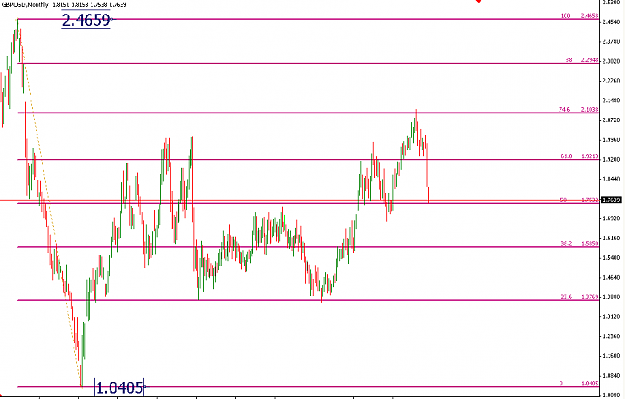
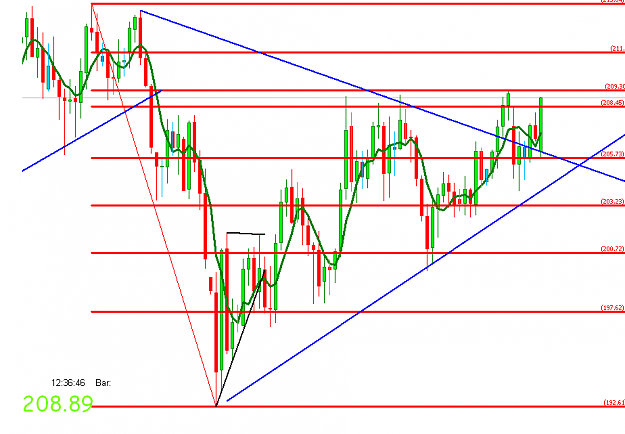
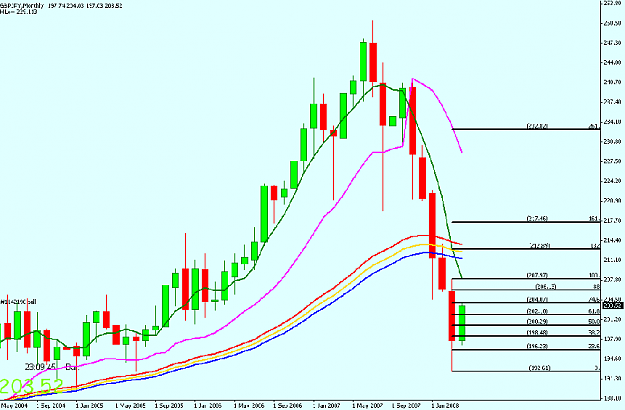
A critical area — A critical area has been touched. There could be an end of this pound selling frenzy, a meaningful retracement or at least a consilidation. Consider this monthly fib and support nearby. Any way next week will tell. happy ...
Cable Update (GBPUSD)
- Jor09 replied Jun 10, 2008
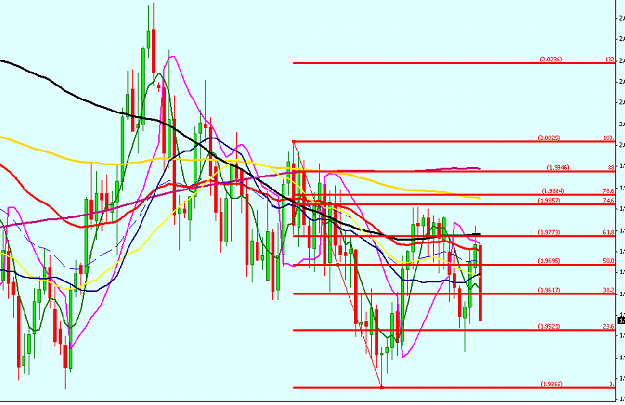
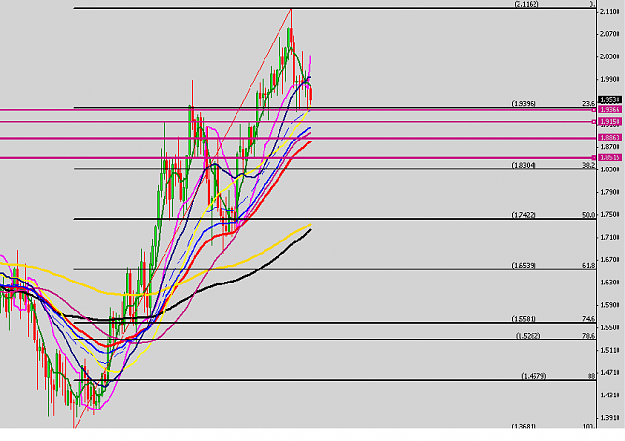
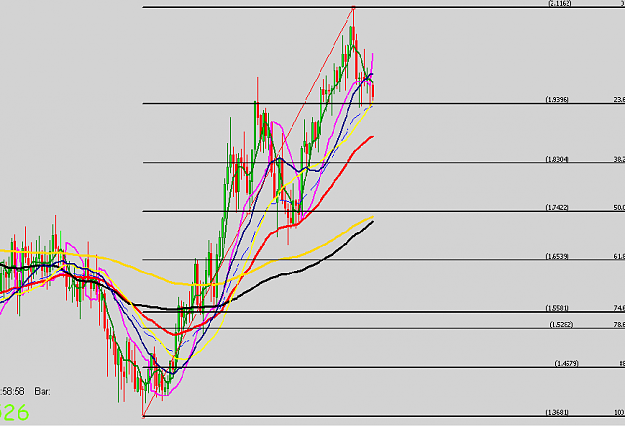
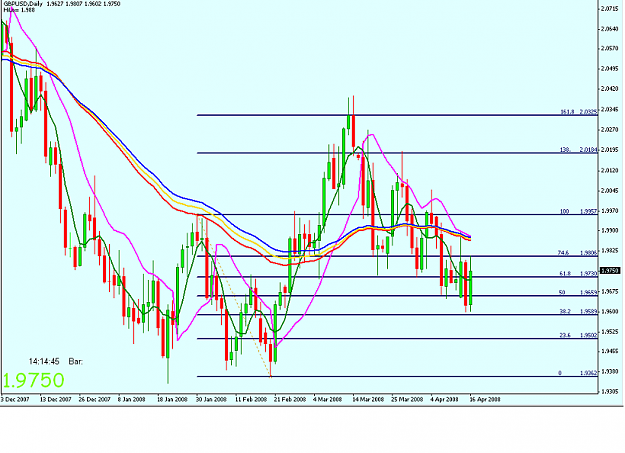
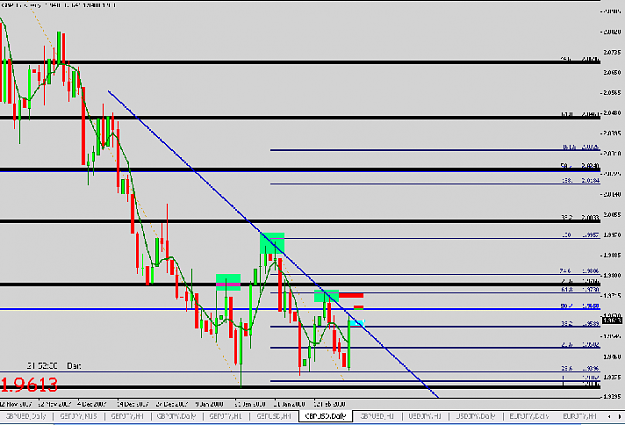
smaller picture — Looking at the smaller picture the fib drown from 2.0697 to 9336 seems to be active and provides good clues in regard of support/resistance.
Jor09 Journal
- Jor09 replied Jun 10, 2008
Some Critical Levels on the Downside — Viole lines represent major area of support. The significance of these comes from the fact that good trade setups could emerge adjacent to them, even counter- trend ones.
Jor09 Journal
- Jor09 replied Jun 10, 2008
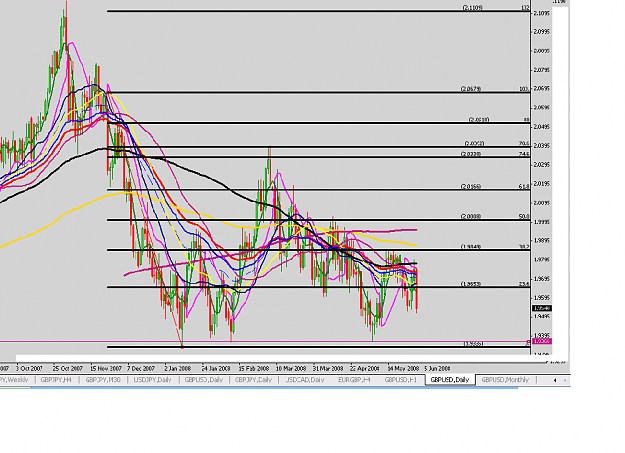
More of the down scenario — If the 9200 area is cleared then 38.6% of this 7500 up move could be next at 8304 area.
Jor09 Journal
- Jor09 replied Jun 10, 2008
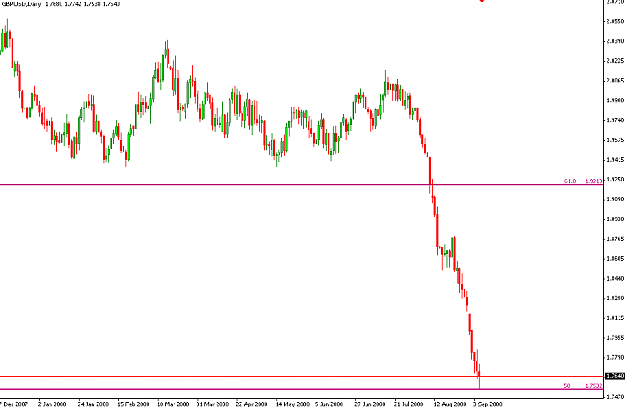
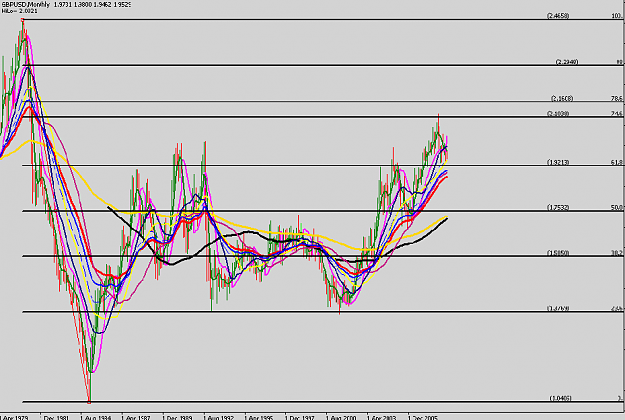
GBPUSD Monthly — GU monthly chart suggests that 9213 area at least should be touched.
Jor09 Journal
- Jor09 replied Jun 9, 2008
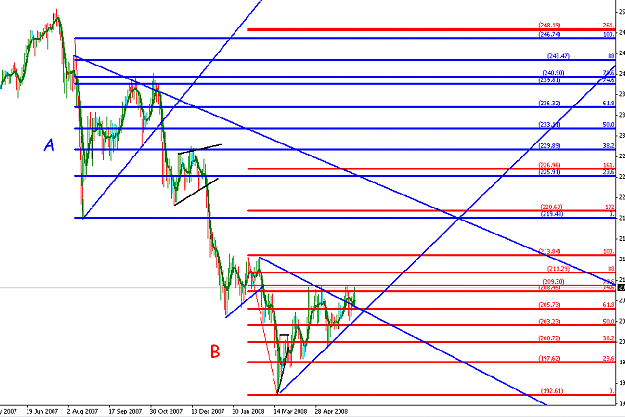
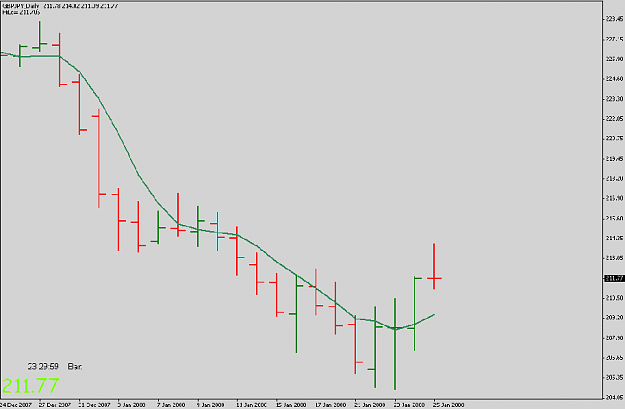
We could have the same pattern that occured in November . 209.30 area is the key.
Auslanco - GBP/JPY and GBP/USD (newstrade)
- Jor09 replied Jun 2, 2008
Just something to consider my fellow bears.
Auslanco - GBP/JPY and GBP/USD (newstrade)
- Jor09 replied May 15, 2008
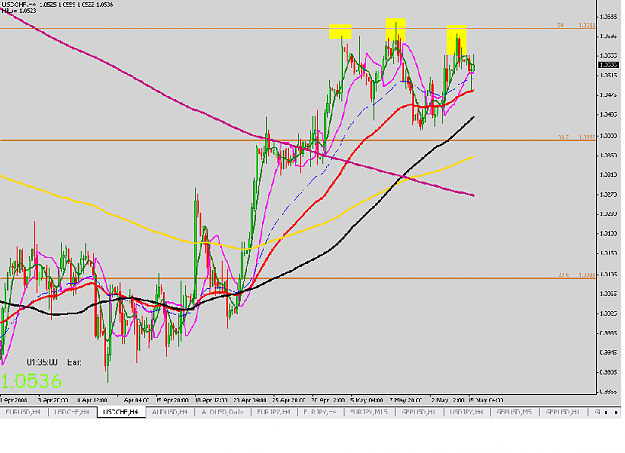
4hr usdchf — What do you guys think about this 4hr usdchf chart? Not a perfect head and shoulders but I think at least some pullback down may happen.
james16 Chart Thread
- Jor09 replied Apr 2, 2008
Something wrong went with FF and they gave a different username. here is the chart
Auslanco - GBP/JPY and GBP/USD (newstrade)
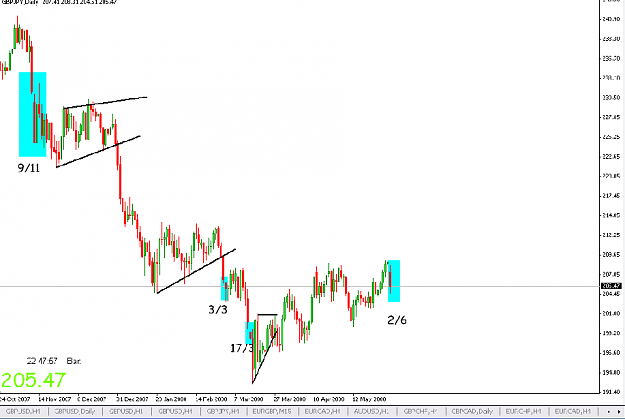
- Jor09 replied Mar 1, 2008
These are my home assignments for the week end. At least one of them could mean something after further analysis. just sharing what I see.
james16 Chart Thread
- Jor09 replied Feb 21, 2008
Gbpjpy is hogging the action here, however these are some gu charts.
Auslanco - GBP/JPY and GBP/USD (newstrade)
- Jor09 replied Jan 30, 2008
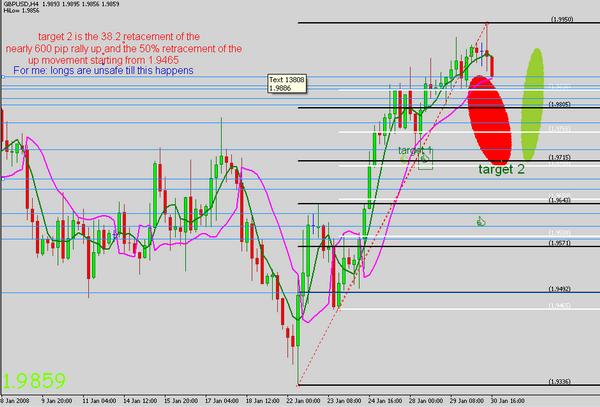
[quote=albertotralzt;1827492]IMHO, a retracement to the 1.9700 area is in play, then up to 2.0300 area. Regards[/quote Nice opinion
Cable Update (GBPUSD) I'm not a regular gu trader but this is a chart.
- Jor09 replied Jan 25, 2008
Daily GBPJPY — I'm relatively new to candlesticks and price action though this what I see. Your comments are appreciated.
james16 Chart Thread
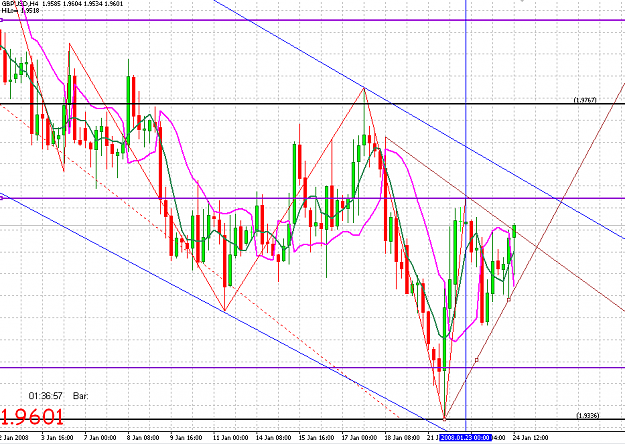
- Jor09 replied Jan 24, 2008
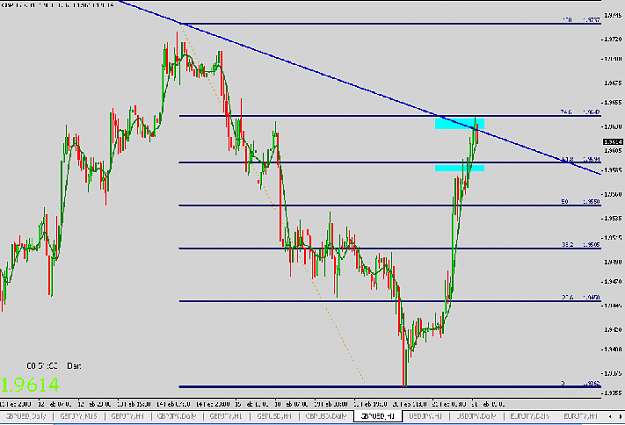
This is what i'm looking at. A break or the 4hr trendline, the brown, would trigger buys to the previous high at 640 area. a break of that level would send price to a more significant level which is the daily trendline at 660 area, the blue one. If ...
Cable Update (GBPUSD)
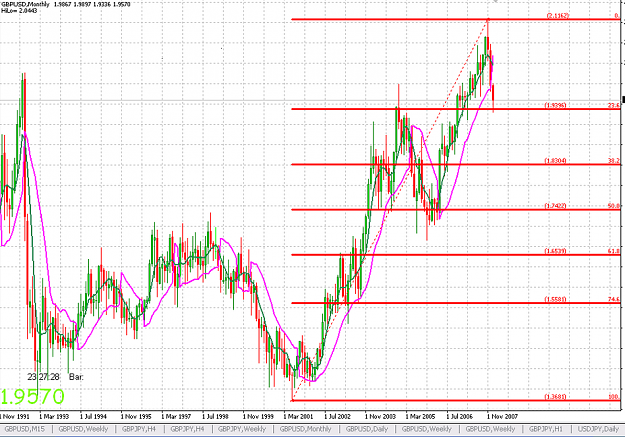
- Jor09 replied Jan 23, 2008
Hi. if you are a fibonacci trader, please tell me what you think about this monthly chart.
Cable Update (GBPUSD)
- Posts by Member Search: 'Jor09'