- Search Crypto Craft
- 31 Results (1 Thread , 30 Replies )
-
 Jimmy Jones replied Jul 26, 2009
Boom. To be fair you won this round though, I'm just observing, won't trade Oanda off hours because of the higher spreads. I might think about it once I have had some more time to test.
C4 Scalping
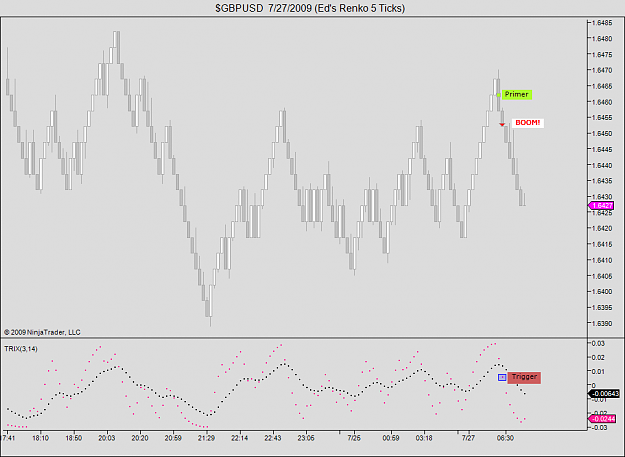
- Jimmy Jones replied Jul 26, 2009
Something I have been working on over the weekend. Cant match the signals from the screen shots edge posted, and frankly I'm done trying for now. I got what I need to blow some stuff up this week, so going to focus on trading and work on nitro next ...
C4 Scalping
- Jimmy Jones replied Jul 24, 2009
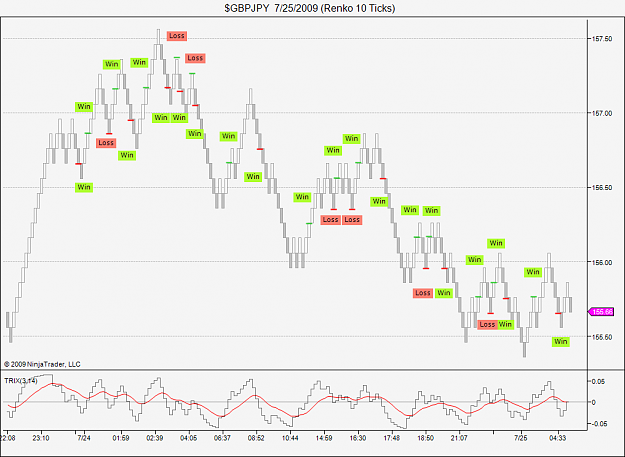
Taking out the trades where the trix cross is not crystal clear leads to better results... 18 Wins = +180 pips 3 Losses = -60 pips Total Pips = 120 Accounting for a 2 pip spread: 18 wins = +144 pips 3 losses = -66 pips Total Pips = 78 pips I could ...
C4 Scalping
- Jimmy Jones replied Jul 24, 2009
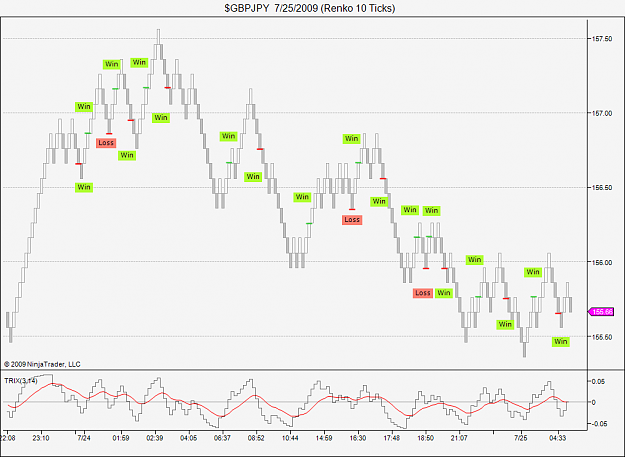
10 Tic Renko GBP/JPY — I did a quick visual test. Results assume winners are worth 8 pips and losers are worth 22 pips. These trades all occurred within the 24th (according to my platform time), so this does also not take into account times ...
C4 Scalping
- Jimmy Jones replied Jul 24, 2009
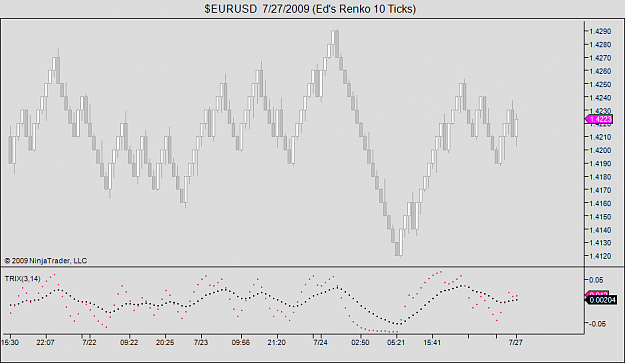
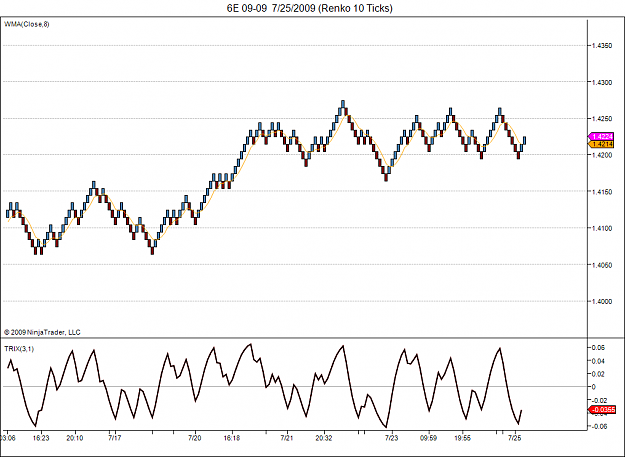
Ninjatrader Renko Chart, 10 tic size (I think). It's a futures feed of EU, I don't have access to the spot market feed (FXCM is supposed to provide it but it's not working for some reason). Not really sure what to think, Renko is a new concept to ...
C4 Scalping
- Jimmy Jones replied Jul 18, 2009
Simplicity — This next week I am going to be focusing on VSA in it's pure form (by pure I mean my interpretation of Master The Markets, after reading it for a 2nd time this weekend). Only HLC bars and volume. No pivots, no fancy level 2 tick ...
JJ's Journal
- Jimmy Jones replied Jul 17, 2009
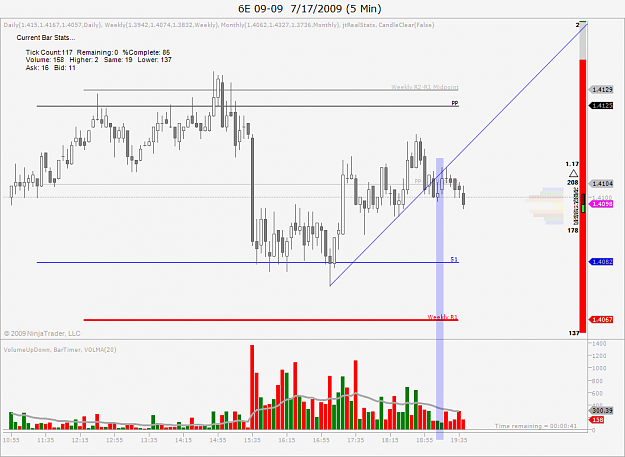
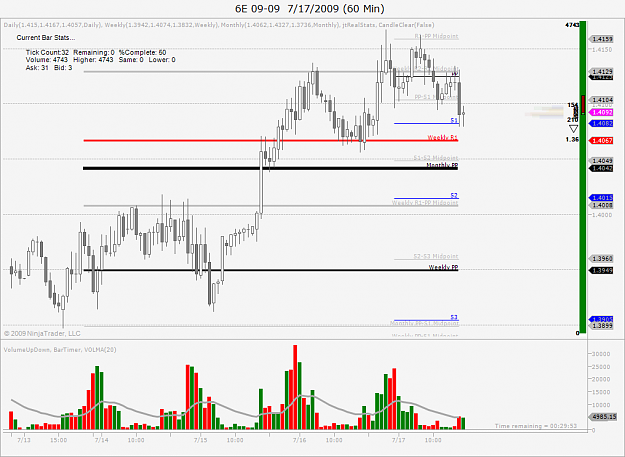
Wanted to post this up so I don't forget to look next week. The last 5 hours or so of the EU move up has been on declining volume. What does this mean? Are we going to see a sell off early next week following this low volume up move? Is this simply ...
JJ's Journal
- Jimmy Jones replied Jul 17, 2009
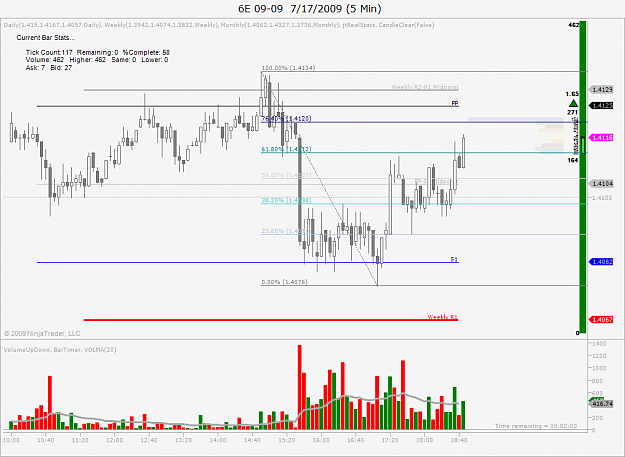
Short EU - 5m Chart — Short EU Entry: 1.4098 Stop: 1.4118 Target: Will move stop to BE with a close below S1, target to Weekly R1 as I suspect we wont just blow through that level. Reason: A break down through a 5m uptrend line, followed by an ...
JJ's Journal
- Jimmy Jones replied Jul 17, 2009
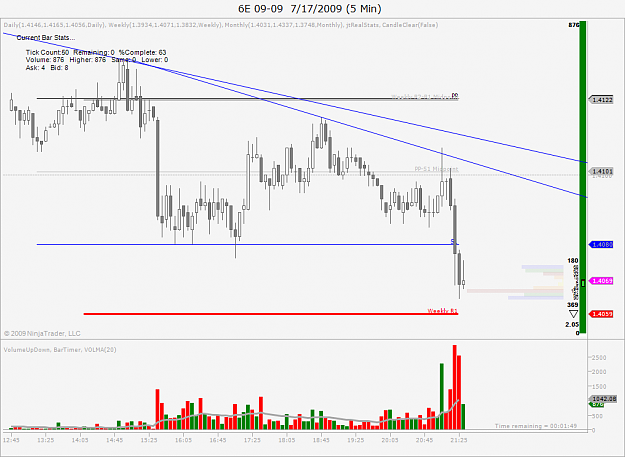
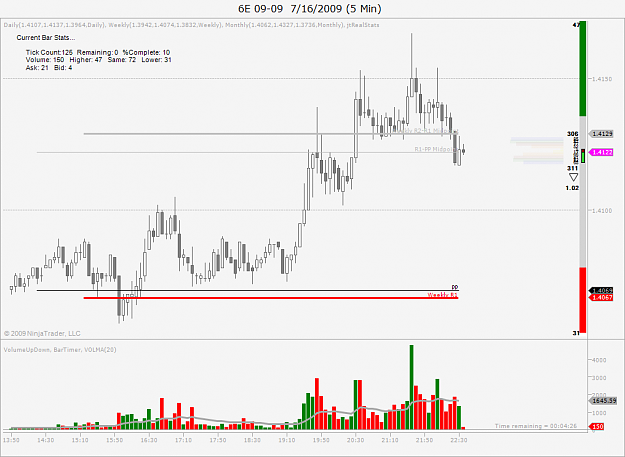
Short EU - 5m Chart — Short EU Entry: 1.4117 Stop: 1.4137 Target: None, will be watching VSA and trailing stop above pivots. Will move stop to BE if 4100 handle is breached and we get a close below. Reason: 5m chart had an upthrust on high ...
JJ's Journal
- Jimmy Jones replied Jul 16, 2009
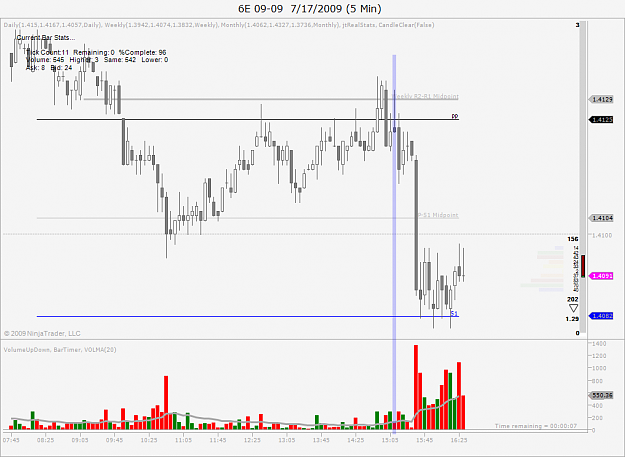
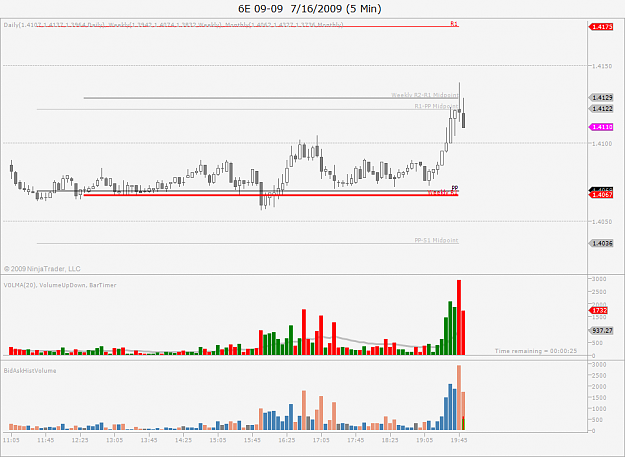
I think the volume picture is pretty clear on this 5m chart. Before we broke through the daily triangle earlier, the volume has been higher on up moves and lower on retraces. Then we got a huge upthrust that I believe was a fake out to sucker late ...
JJ's Journal
- Jimmy Jones replied Jul 16, 2009
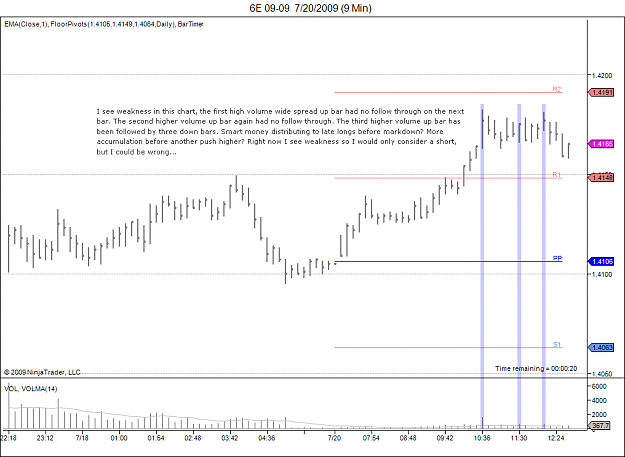
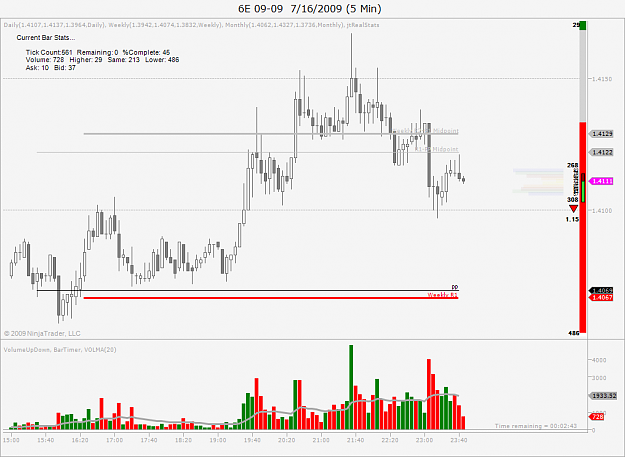
It looks like the extremely high volume wide spread up bar closing near the lows might have been smart traders liquidating into the highs before the markdown phase begins. We now see a push through the mid pivot confluence on slightly higher volume, ...
JJ's Journal
- Jimmy Jones replied Jul 16, 2009
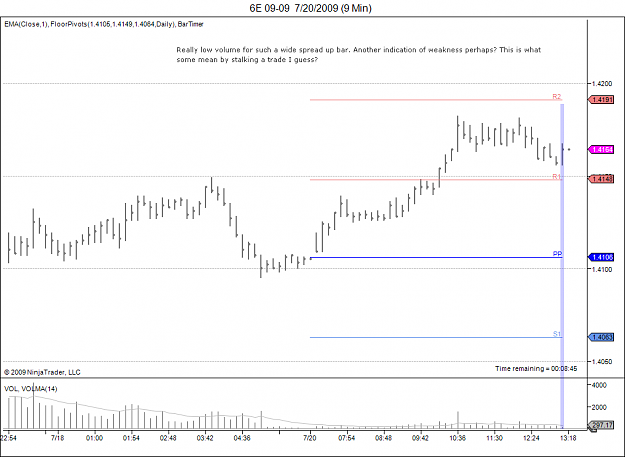
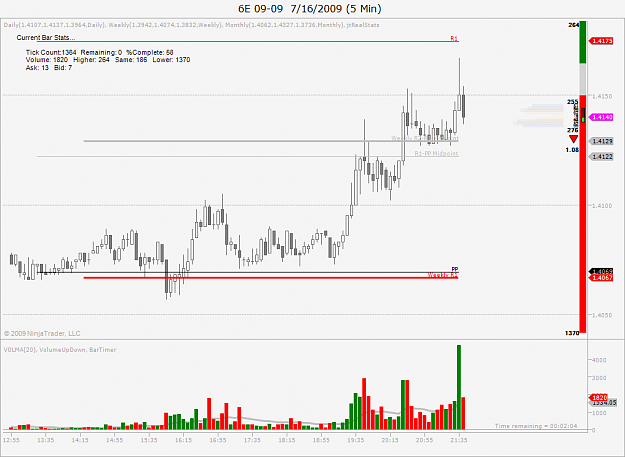
Ultra high up bar volume with a wide spread bar. Is this professional money liquidating into the highs, trapping people into bad long positions taken on the basis of a possible triangle breakout on the daily?
JJ's Journal
- Jimmy Jones replied Jul 16, 2009
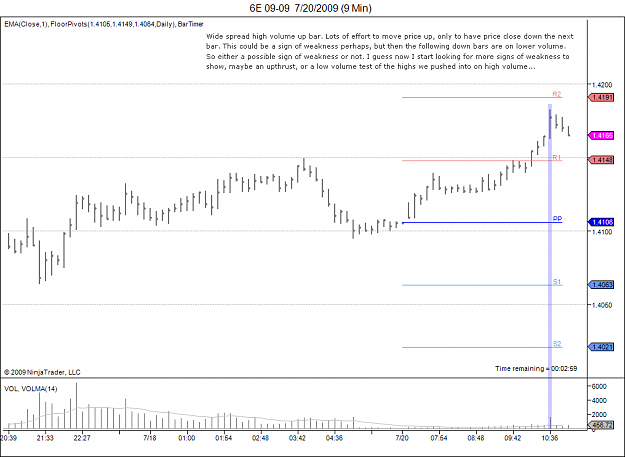
So now we have the highest volume of the day on up bars, and then we have a big volume rejection type bar that tried to move up through Weekly and Daily mid pivot confluence and got rejected, again on the highest volume of the day so far. What kind ...
JJ's Journal
- Jimmy Jones replied Jul 16, 2009
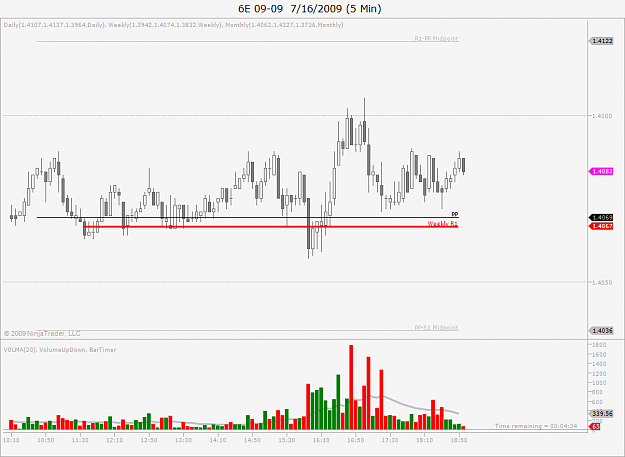
Now we having rising prices on falling volume, which is considered bearish divergence I believe.
JJ's Journal
- Jimmy Jones replied Jul 16, 2009
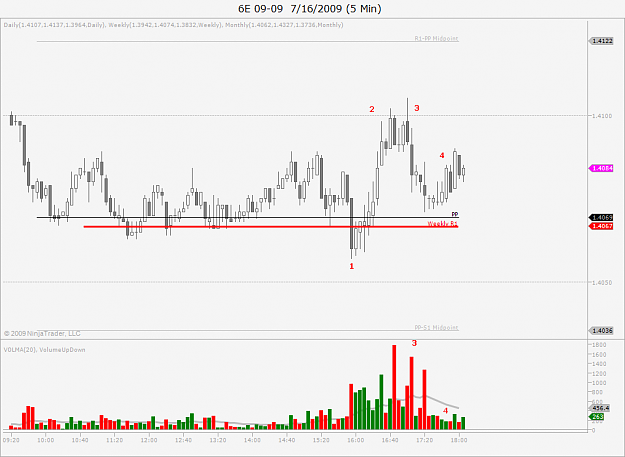
Wanted to post a 5m chart with some observations, for me to remember when I am looking back at my posts in the journal. 1 - EU 5m chart, price bounced of the confluence of daily pivot and weekly R! several times before a high volume spike broke ...
JJ's Journal
- Jimmy Jones replied Jul 14, 2009
Price has pushed down through the Daily Pivot, retested and failed, and then a big push down through the Weekly Pivot / 3950 psych confluence area. If I was in the correct mindset I would stay at it and look for a retest and rejection of that 3950 ...
JJ's Journal
- Jimmy Jones replied Jul 14, 2009
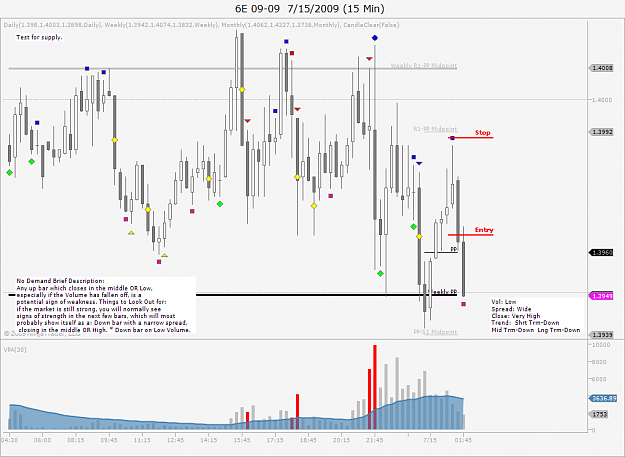
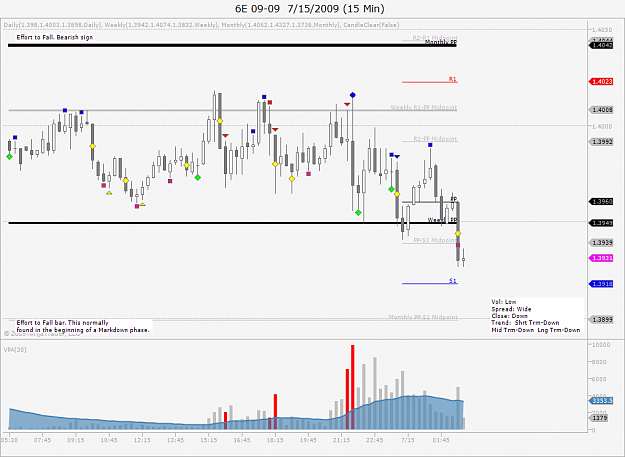
Short EU - 15m Chart — Short EU Entry: 1.3964 Stop: 1.3984 Target: None, will be watching VSA and trailing stop above pivots. Reason: 15m chart had a Pseudo Upthrust bar up to the Daily R1 Mid Pivot. All day long we have been stuck in this ...
JJ's Journal