- Search Crypto Craft
- 112 Results
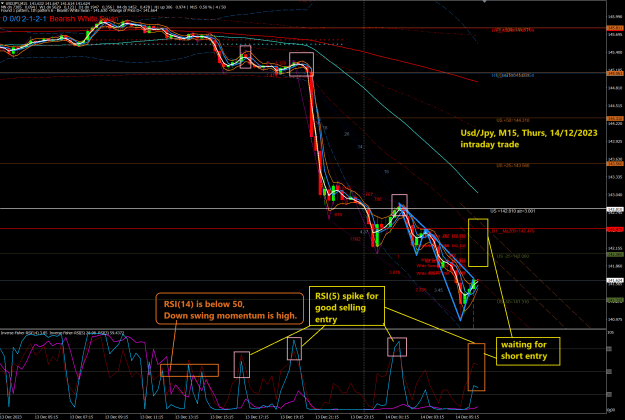
- Jack168 replied Dec 14, 2023
RSI is the momentum oscilator indicator. It is not a good indicator for trend direction. RSI reliability depends on selection of period parameter, eg. 14 or others, and price cycle. But, it can assist entry. eg. for a down trend, waiting for ...
Twin RSI - simple trading strategy
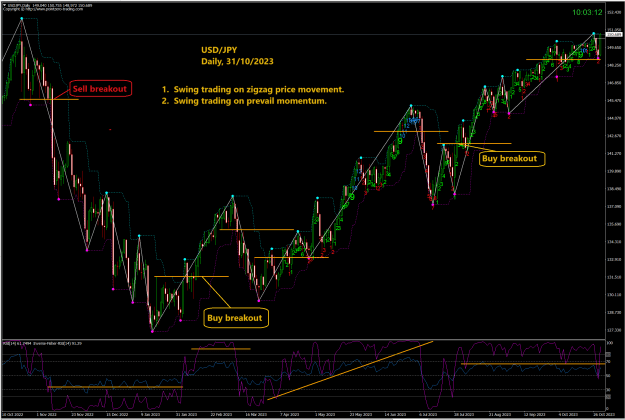
- Jack168 replied Oct 31, 2023
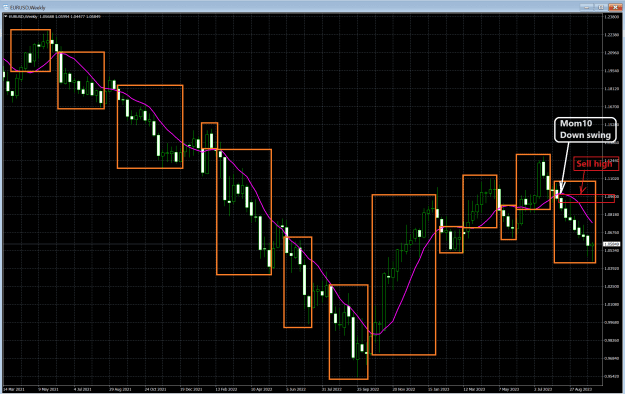
What are criteria to assess whether a swimg trading system is good or bd? (1). it can follow price swing or follow zig zag price movement. when you can catch zigzag, no worry about other things. (2). it run on positive momentum, and stay with ...
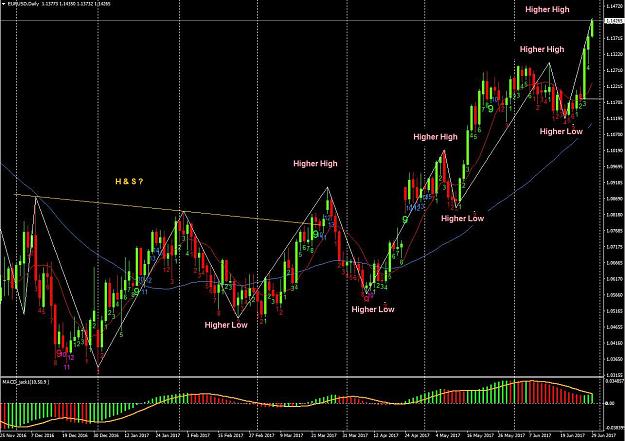
Swing Trades using Price Action
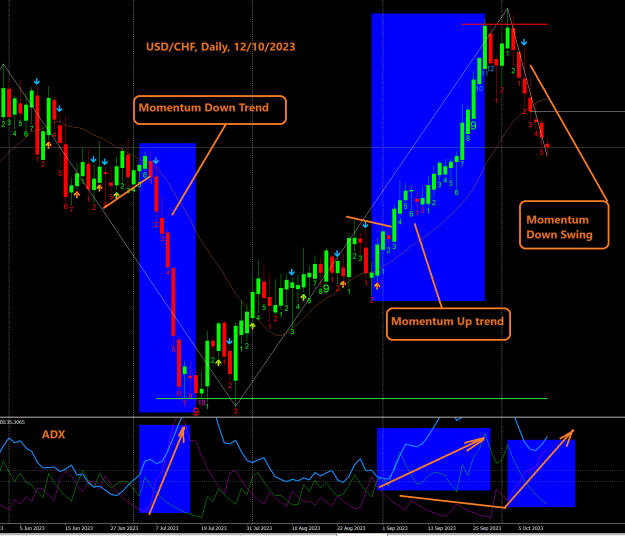
- Jack168 replied Oct 12, 2023
Good momentum swing on USD/CHF, daily chart. Momentum killer.
EURUSD Momentum Swing Trading
- Jack168 replied Oct 11, 2023
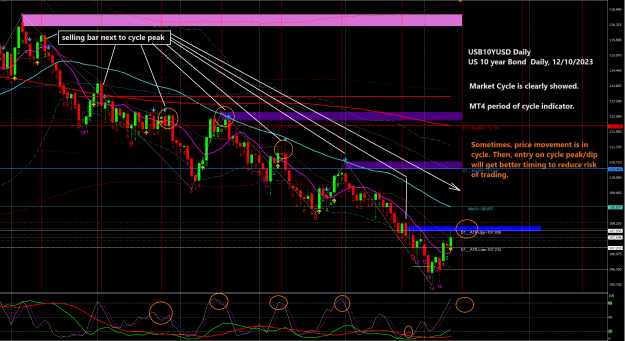
Yes. When price shows its cycle and continue going its cycle. Entry on cycle peak and dip would be the best trading strategy. One problem are: (1). market cycle may change its period a bit. (2). trend direction change cause to redefine period of ...
Trade based on Market Cycle Indicator
- Jack168 replied Oct 7, 2023
I help you a bit. 1. Momentum trade is better for you. Momentum trading method has been wide used for many years for those momentum funds, which is well known, but, less talked in public. 2. Weekly chart is used for setting momentum direction: up ...
A Cry for help
- Jack168 replied Sep 26, 2023
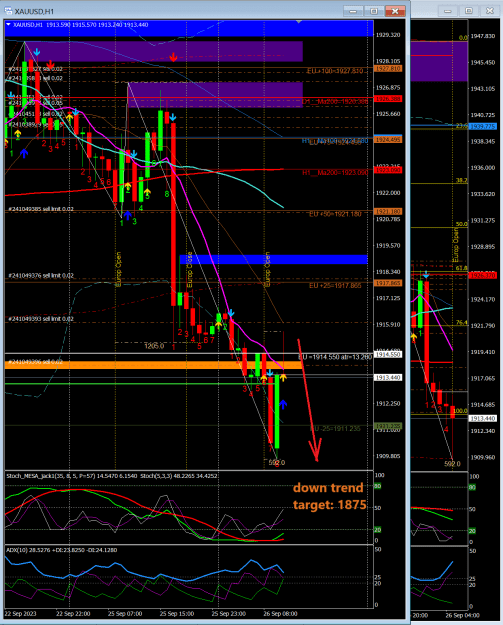
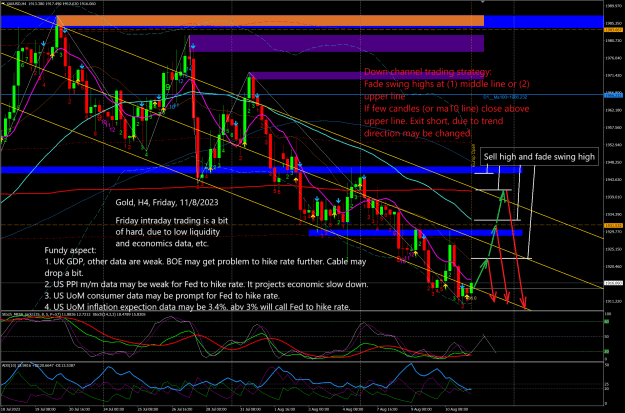
Gold got a nice down trend. Target: 1875 level. Sell high is a way to add short. image
Gold
- Jack168 replied Aug 11, 2023
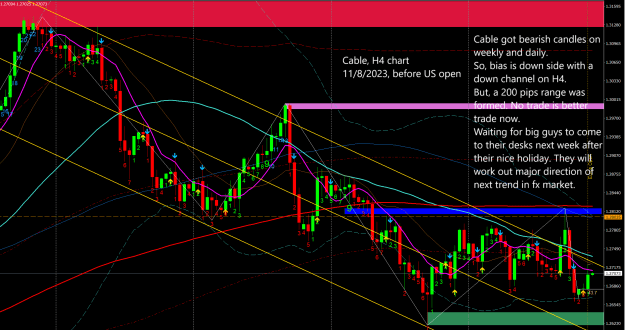
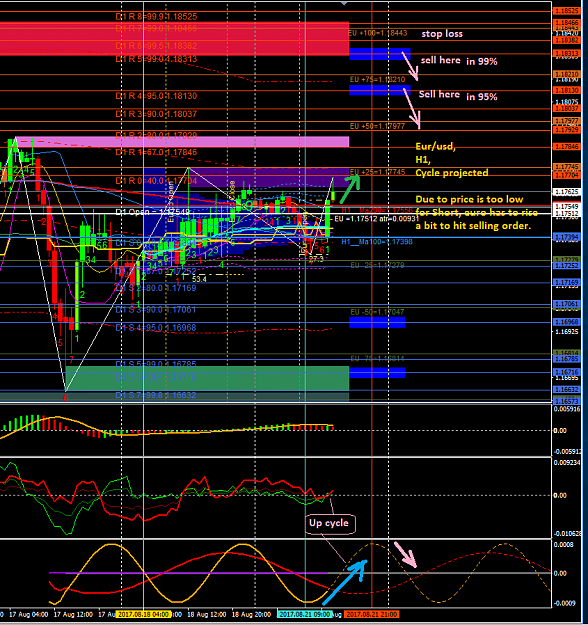
My view. No trade is better trade at momentum. image
Cable Update (GBPUSD)
- Jack168 replied Apr 25, 2018
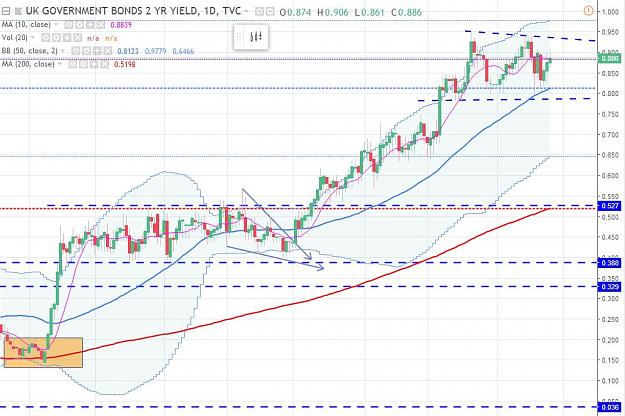
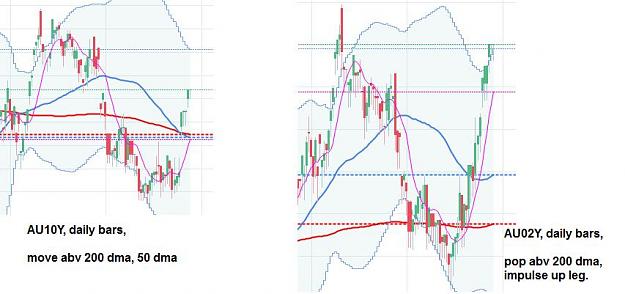
UK, Aussie may rise their rate first than other central banks. So, when the market shift to this expectation, GBP, AUD will boost up as bullish trend emerging out. You get in, then, wait for speculation developed out. Attach a daily chart of UK 2 ...
Fundamental Trading
- Jack168 replied Dec 26, 2017
This is why Aussie moved up quickly in few days.
Why AUDJPY changed its direction so quick
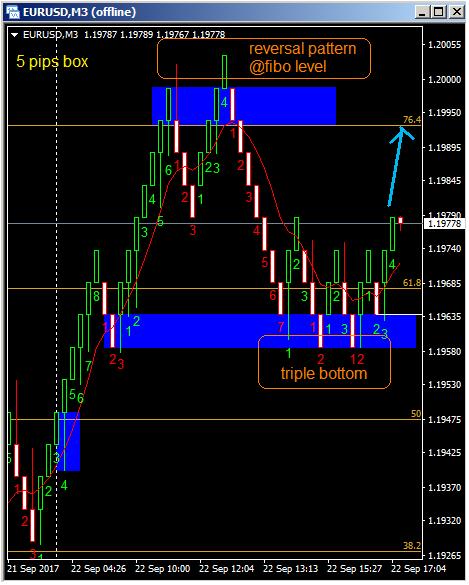
- Jack168 replied Sep 22, 2017
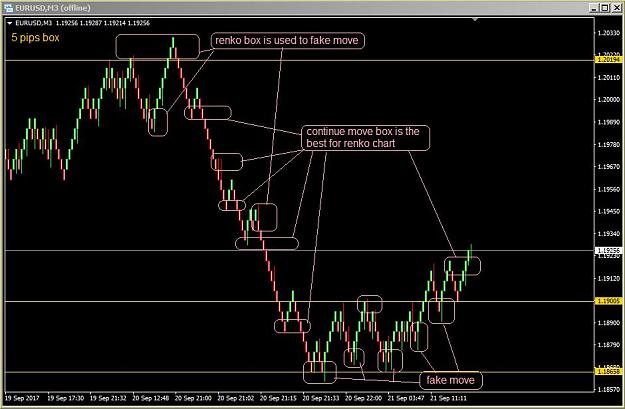
look for reversal pattern at fibo level is a way.
How do you trade renko?
- Jack168 replied Aug 21, 2017
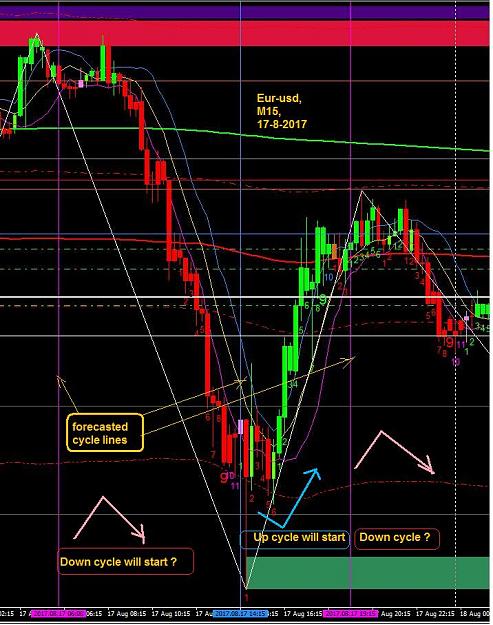
Weekly open often be hard to work out directional bias. Sometime, Hourly chart is very good to spot cycle, which is my favor. I use 2 days cycle (red color), next may be one day cycle.
Spectrometer indy seems good for trading
- Jack168 replied Aug 19, 2017
Forecast of intr-day cycle has error. But, sometime, it works, which give you a real edge for your trading system.
Spectrometer indy seems good for trading
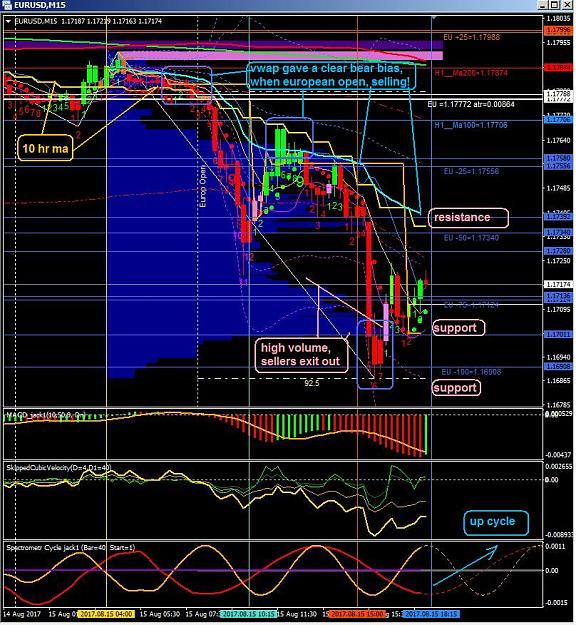
- Jack168 replied Aug 15, 2017
no worry, enjoy! vwap is a powerful ma which independs with various time frames for intraday trade. it can give out a clear cut-off directional bias and risk control. a lots of algo live on it.
Market Statistics (Volume Histogram, VWAP with SD bands)
- Jack168 replied Aug 14, 2017
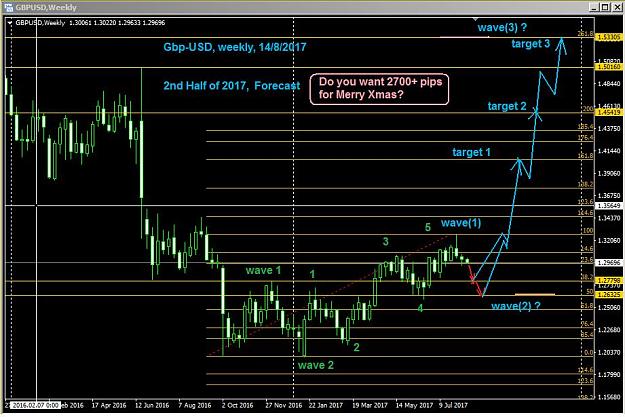
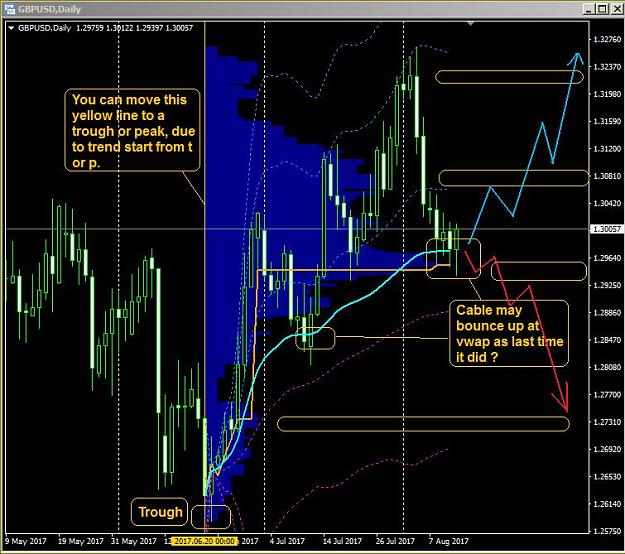
2nd Half of 2017 year start now. Summer Holiday should end. Gbp-usd did swing up 1000+ pips in 1st H, and formed a 3 driver bullish pattern as wave (1). Then, next down leg as wave (2) will hit 23.6% - now level, or 38.2% - 1.2780 level or 50% - ...
Pound Trader Weekly Message

- Jack168 replied Aug 11, 2017
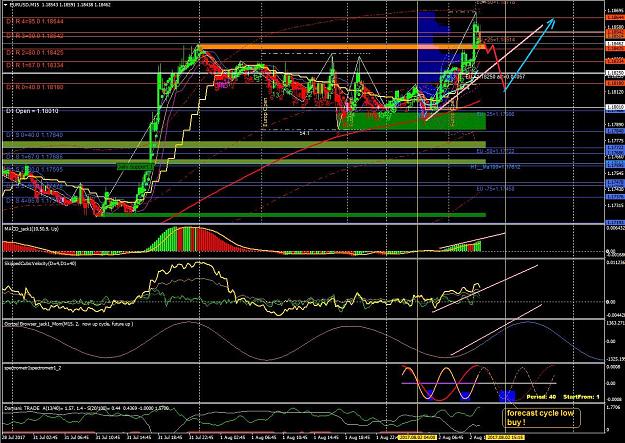
For intraday use, "daysBack" = 0; "startHour" =4, (Asian Open), you can select any time. "startMinute=xx". You can set up these two time parameter to move Gold color vertical line to a location, eg European open, London open, or US open. I prefer ...
Market Statistics (Volume Histogram, VWAP with SD bands)
- Jack168 replied Aug 2, 2017
screenshot, M15, eur-usd, 2/8/2017. Spectrometr_Separate_Selective Cycle 2.04.mq4 is used to forecast cycle low for buy entry.
Spectrometer indy seems good for trading
- Jack168 replied Jun 29, 2017
Why do you need monthly chart? or weekly chart? Is Daily chart not enough for directional bias/filter?
Long Term Trades