- Search Crypto Craft
- 307 Results
-
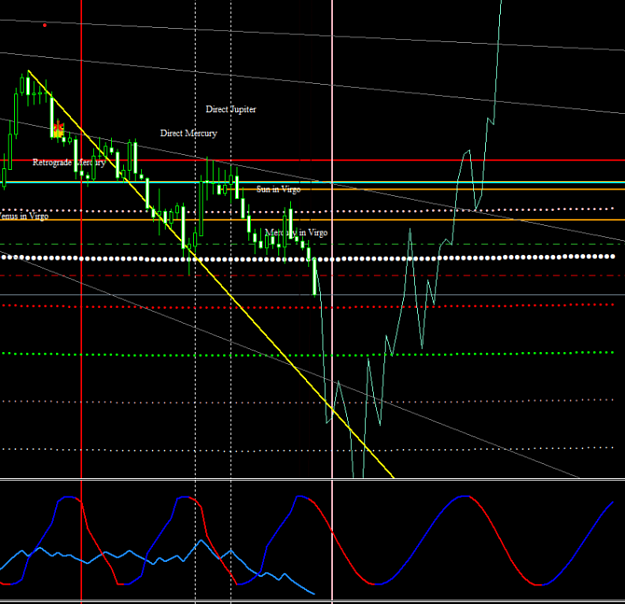
 Ilovepippin replied Feb 12, 2022
52? Where have we seen that before? My chart of EURUSD: image
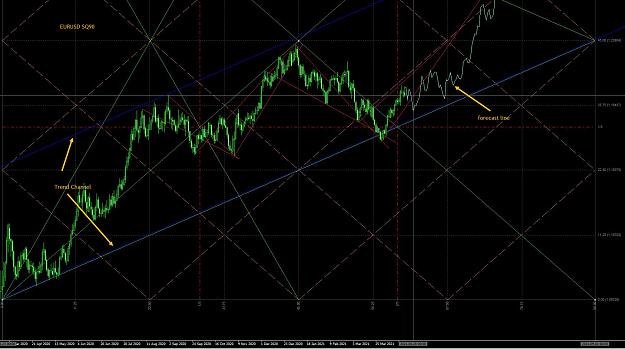
Planetary Cycles Trading (EUR/USD)
- Ilovepippin replied May 18, 2021
So I get a lot of questions on how this all works. I see just by all the trolls we got over the years that there is a lot of misunderstanding about using astro as a guide for our trading decisions. Gann used the wisdom of the bible and through his ...
Planetary Cycles Trading (EUR/USD)
- Ilovepippin replied Apr 23, 2021
In Jensens book he explains a Geometric theory that enables you to predict highs and lows in the future. This chart is from IBM. It is pretty accurate and even made highs and lows if the cycle theory did not agree. A copy of the book is attached. ...
Planetary Cycles Trading (EUR/USD)
- Ilovepippin replied Apr 2, 2021
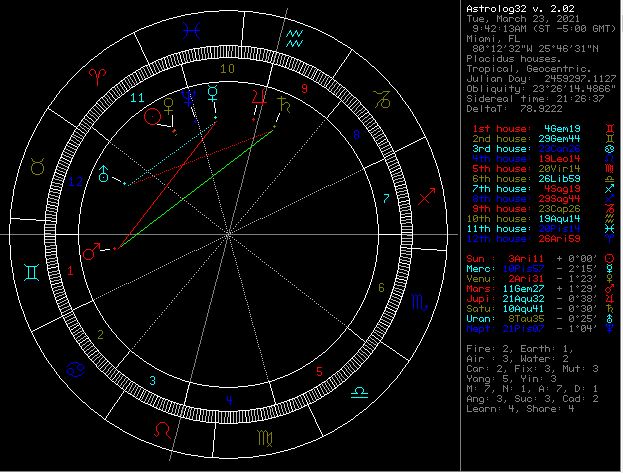
The cycle went inverse from March 23, till March 31. This is what was happening in the heavens at that time. Follow the aspects and see if you can find the culprit. Then check past occurrences and apply to the future. image
Planetary Cycles Trading (EUR/USD)
- Ilovepippin replied Feb 10, 2021
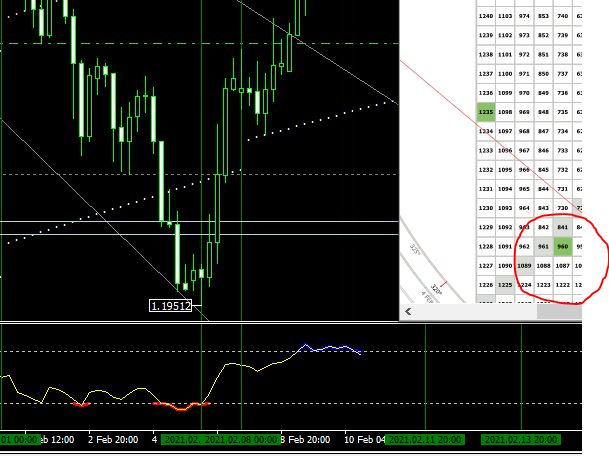
EURUSD made a bottom at 83 degrees Helio Mars at a price of 1.19.51 which was only 9 pips short of the 1.960 price target on the SQ 9. Gann called that "loss of momentum". What happens in these cycles is that price repeats price angles. If you know ...
Planetary Cycles Trading (EUR/USD)
- Ilovepippin replied Jan 20, 2021
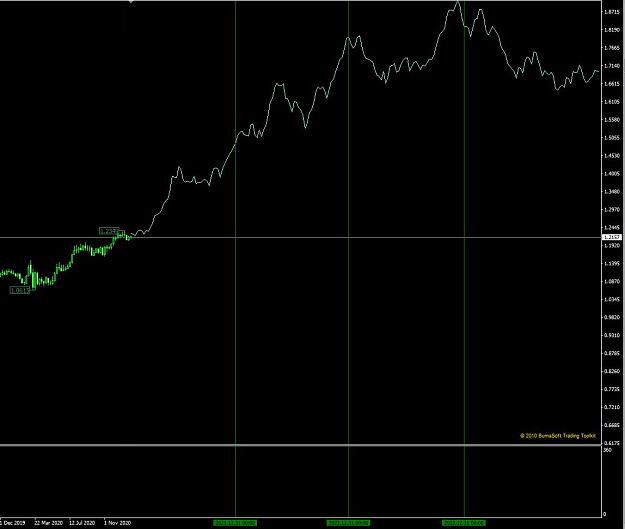
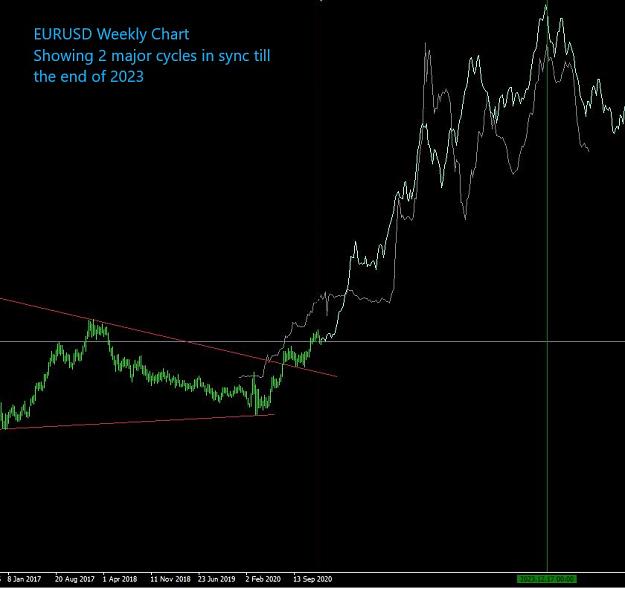
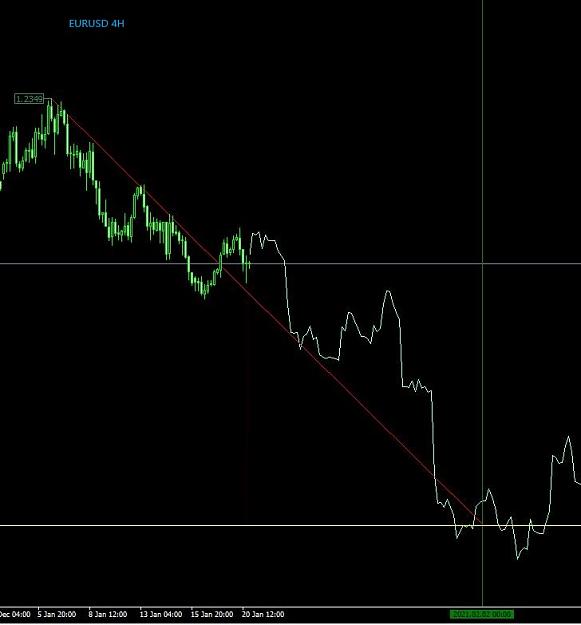
UPDATE: EURUSD will continue the downtrend, I'll be honest, I miscalculated by 2 weeks, it will continue till the end of January/ early February and then possibly go sideways a little. image Now, in 2021 we can now plot 50 years of data in ...
Planetary Cycles Trading (EUR/USD)
- Ilovepippin replied Jan 17, 2021
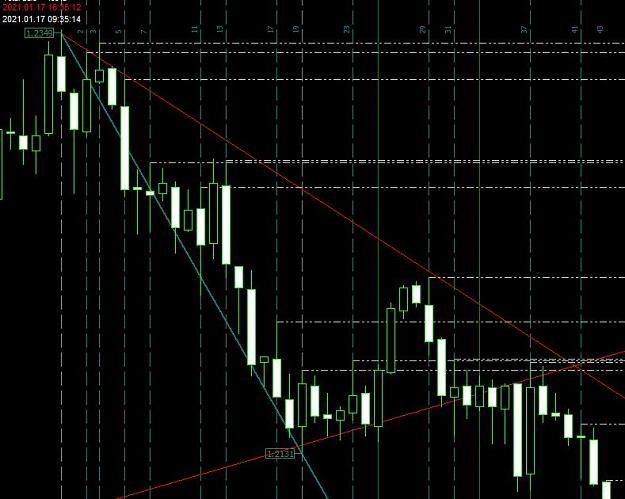
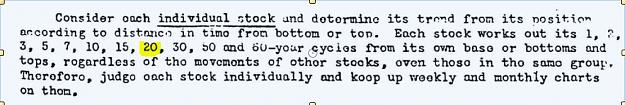
One thing I want to point out to Gann seekers. Gann always throws the numbers 3 5 and 7 around, amongst other. You can count bars and see that often trends (temporarily) change once price reaches 3, 5, 7 etc bars. But, they are also prime numbers. I ...
Planetary Cycles Trading (EUR/USD)
- Ilovepippin replied Mar 28, 2020
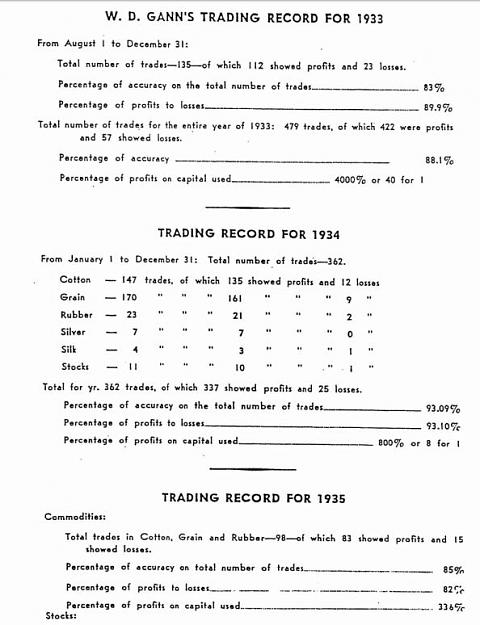
Can you prove that statistically? Not that I think Gann is "the" answer, it is just a small piece in the bigger puzzel but he did test his methods and has proof. Statistically significant maybe as sample size was over 500, evidence that whatever he ...
Planetary Cycles Trading (EUR/USD)
- Ilovepippin replied Mar 24, 2020
Jupiter Saturn has another significance as some people believe it was the 20yr cycle that Gann was referring to. Which I don't believe to be true because the 20 yr conjunction is part of a larger 60 year cycle. image
Planetary Cycles Trading (EUR/USD)
- Ilovepippin replied Mar 14, 2020
MT4 max data capacity is till 01.01.1970. However the time is a variable in this indicator. Just adjust it. See pic.
Planetary Cycles Trading (EUR/USD)
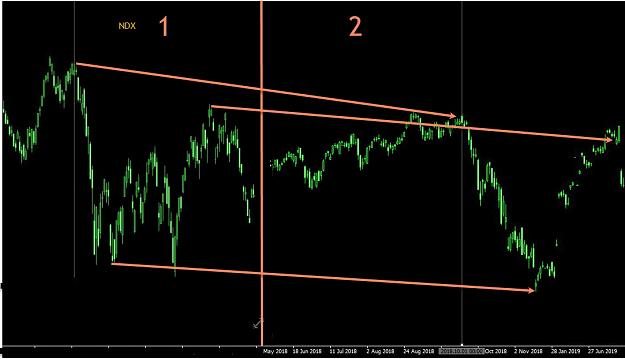
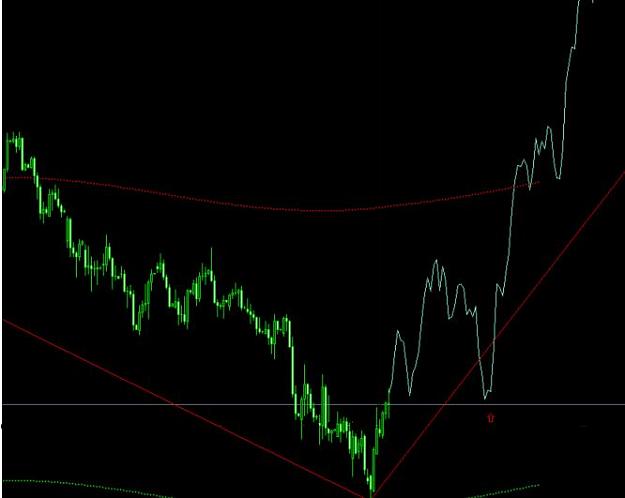
- Ilovepippin replied Oct 13, 2019
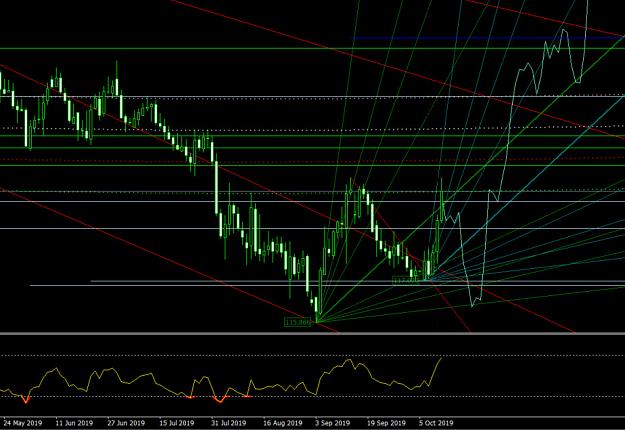
This was my forecast last month. This is what happened: The move was indeed initially down, but a little longer that expected. We will see another downturn and eventually a larger move up. image
Planetary Cycles Trading (EUR/USD)
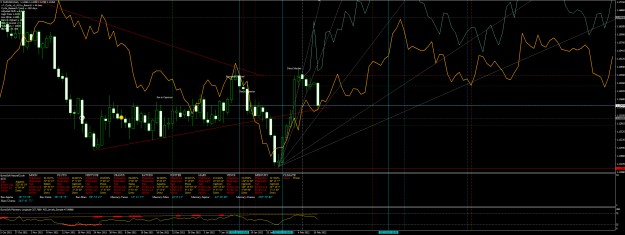
- Ilovepippin replied Oct 6, 2019
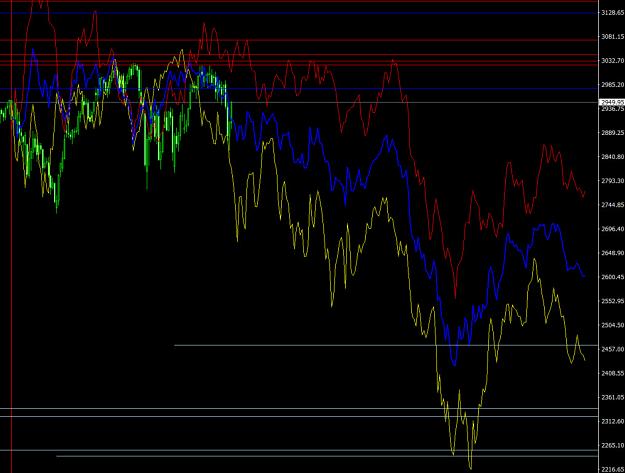
This is the SP500 with its 2 closest short term cycles. The blue line is the composite. image
Planetary Cycles Trading (EUR/USD)
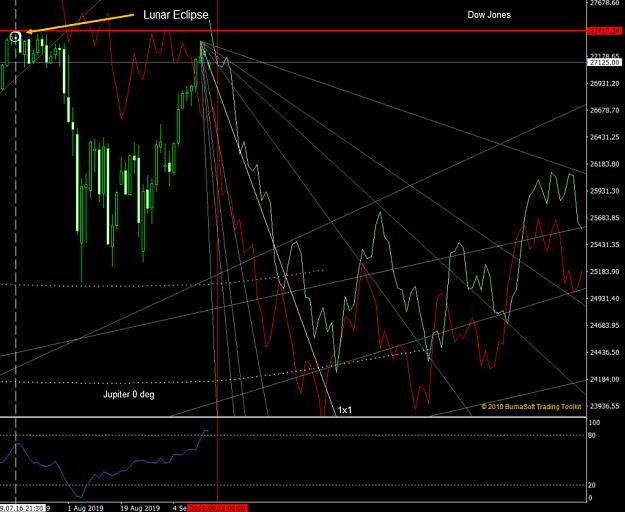
- Ilovepippin replied Sep 15, 2019
I agree that the outlook is bearish. Since the lunar eclipse the market has not been able to reach the same high. At this point it may happen, but if so it won't be long before it falls below and the market will be bearish/sideways until at least ...
Planetary Cycles Trading (EUR/USD)
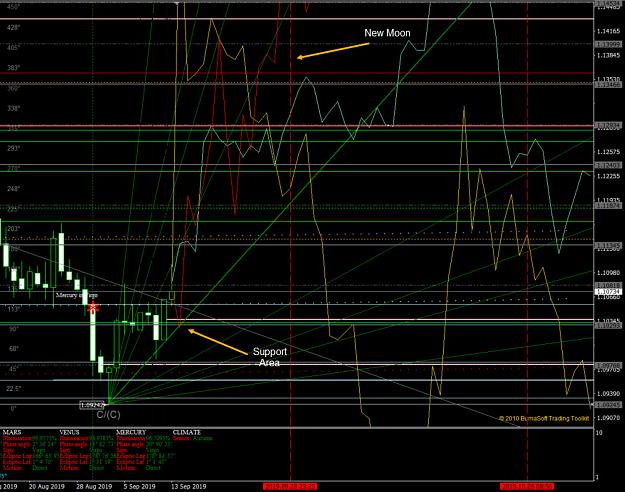
- Ilovepippin replied Sep 14, 2019
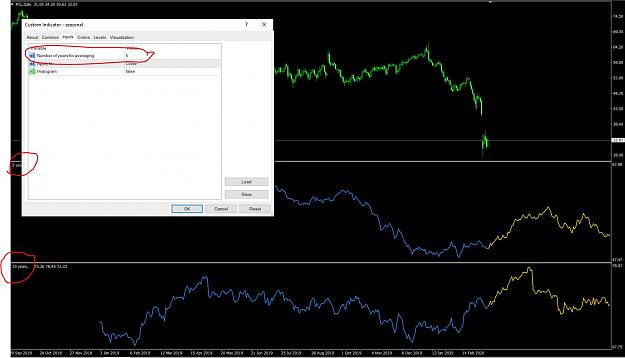
So, this possibility did not pan out. Didn't lose any money, gained a little. EURUSD got stuck at 1.09245. It could not get passed Jupiter 270 degree long. Below I show the spectrum for the EURUSD. If we indeed have a bottom, the spectrum shows ...
Planetary Cycles Trading (EUR/USD)
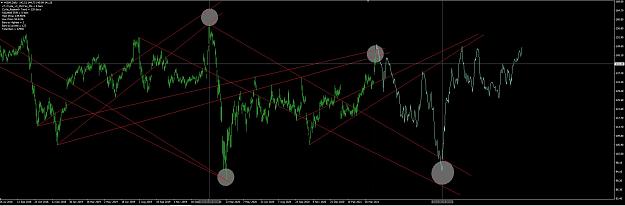
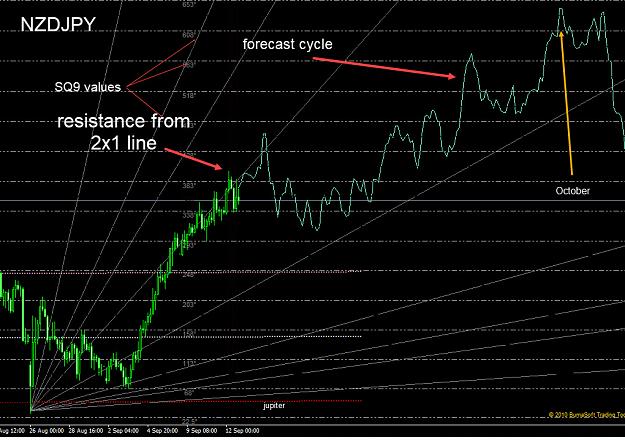
- Ilovepippin replied Sep 12, 2019
I am 200+ pips in the plus on my Yen trade and see a similar opportunity on the NZDYPJ. image
Planetary Cycles Trading (EUR/USD)
- Ilovepippin replied Sep 11, 2019
Correction!! This is a EURUSD topic, but ill be honest, Euro and myself don't vibrate very well together. So, instead Ill post what I think could be an opportunity in the Yen crosses and this one is specific to the EURJPY. I expect this pair to soon ...
Planetary Cycles Trading (EUR/USD)
- Ilovepippin replied Aug 30, 2019
Euro Alert. This thing can go all the wat to the 1.07 area. image
Planetary Cycles Trading (EUR/USD)
- Ilovepippin replied Jul 24, 2019
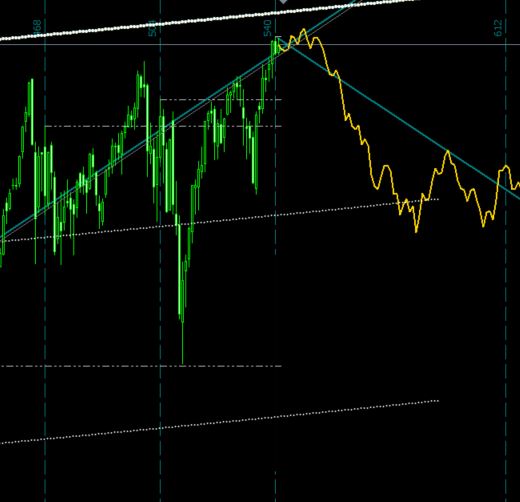
My view for the Dow. We are at the brink of a long recession. image
Planetary Cycles Trading (EUR/USD)