- Search Crypto Craft
- 105 Results
-
 IMARICH1 replied Oct 12, 2016
sisse, This is why i switched. I was confused on the range we use and both ranges were in the MIDDLE which was indeed a bad choice. I am not sure why I did this to be honest. For some reason, I was thinking we were at the extreme in this range or ...
The Really Useless Thread
- IMARICH1 replied Sep 29, 2016
Ok sisse! But, need to atleast post a chart for Pharm0r and we can tear it up later... sisse, Please post what we should be watching to understand market conditions and what is happening. I am watching DAX, 10 yr T-Bonds and news. You watch ...
The Really Useless Thread
- IMARICH1 replied Sep 29, 2016
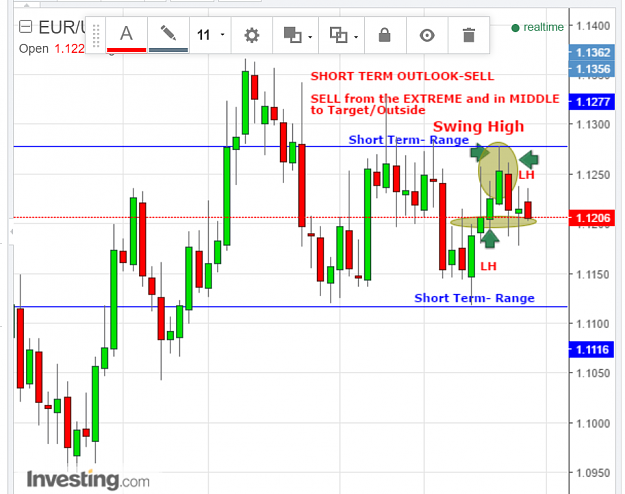
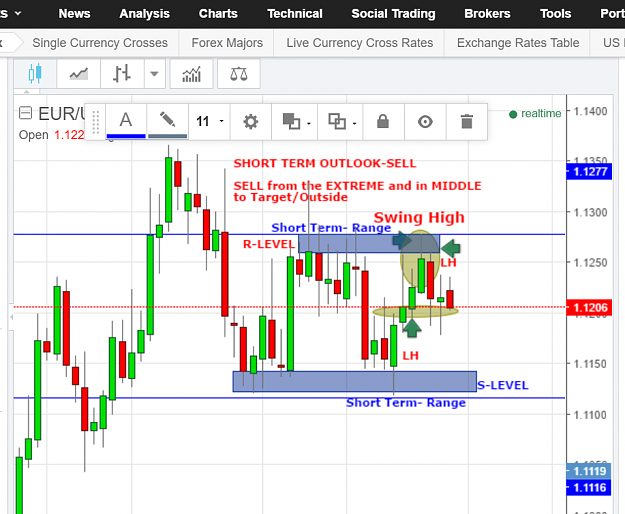
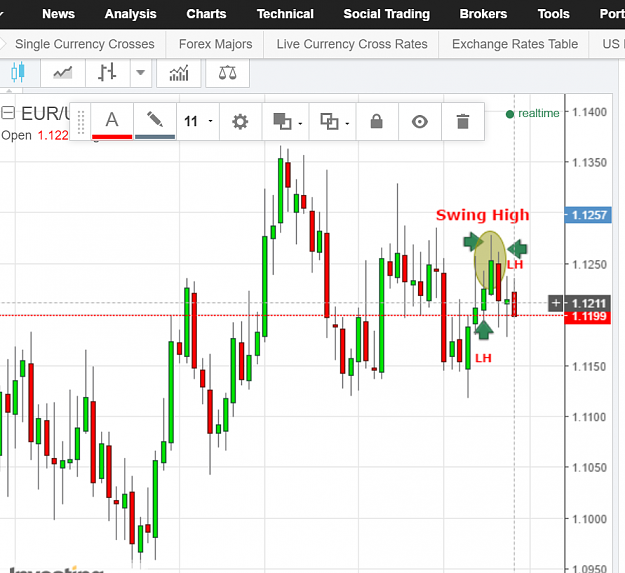
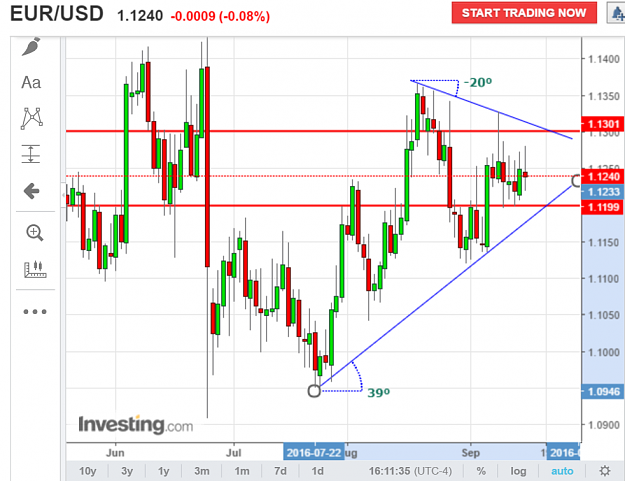
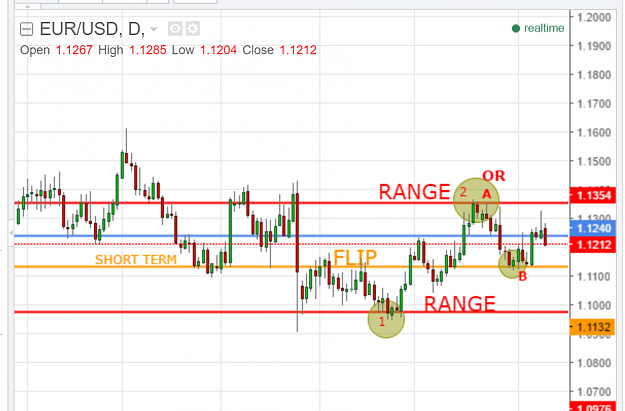
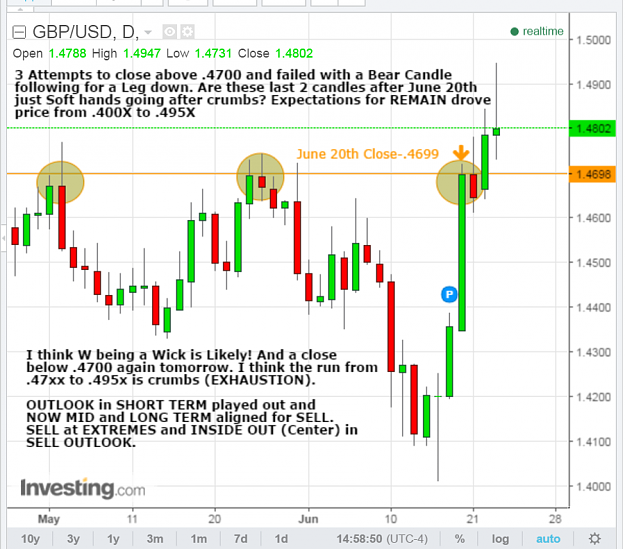
primejarvis, It appears to be a Swing High in the Wave from what I gathered from sisse's post. These can happen on any TF; but, the Bigger the TF the more valid. I used a DAY Chart. And the OUTLOOK in Short Term is SELL now so you can SELL in middle.
The Really Useless Thread
- IMARICH1 replied Sep 29, 2016
Perhaps, this day chart is revealing a SWING HIGH?
The Really Useless Thread
- IMARICH1 replied Sep 23, 2016
I am sure I will get scolded here with "Why all the lines? I asked you to mark 2 simple lines.....and you just f'd it up"..... I am a visual learner.....Better yet, A slow learner....
The Really Useless Thread
- IMARICH1 replied Sep 16, 2016
LONG NIGHT. Got home at 3am sisse when you were up and ready to go! As promised.....I really feel you will make me appear foolish when to me its a no brainer. Perhaps, I will learn something here as I learn better with visuals than just words.
The Really Useless Thread
- IMARICH1 replied Sep 15, 2016
Cant see how either would cause a Momentum Leg.... EDIT: It is possible looking at that .120X could and .130X would not.....That would break a TL on a DAY chart. Crap, I may have answered WRONG. I am leaning towards .120X being a MOMENTUM SHORT TERM ...
The Really Useless Thread
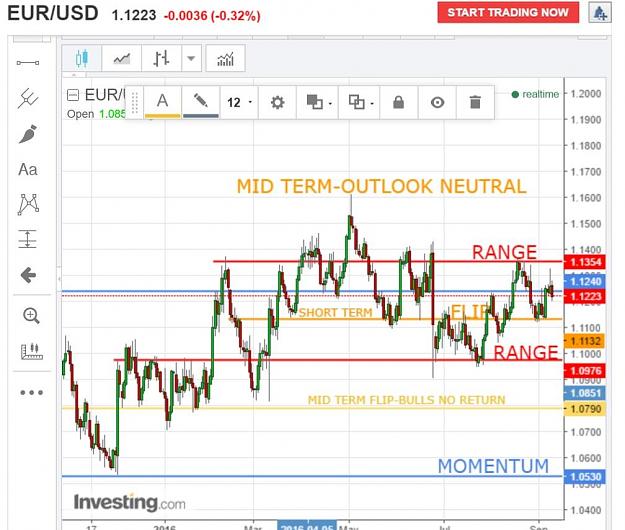
- IMARICH1 replied Sep 15, 2016
Nothing has changed YET since the summer but closing in..... Short term I would think MOMENTUM lines would be my RANGE lines? And, Honestly, I am not sure where I would change my FLIP lines on Diff Outcome (SHORT/LONG). These lines represent the ...
The Really Useless Thread
- IMARICH1 replied Sep 13, 2016
sisse, Thanks, but still trying to understand what does " all large bids will be raised for a few handles down the road till the FED". What does this look like? .08XX or .073X as a MID TERM LEG? If we breech .1200 handle, then, OUTLOOK in EU changes ...
The Really Useless Thread
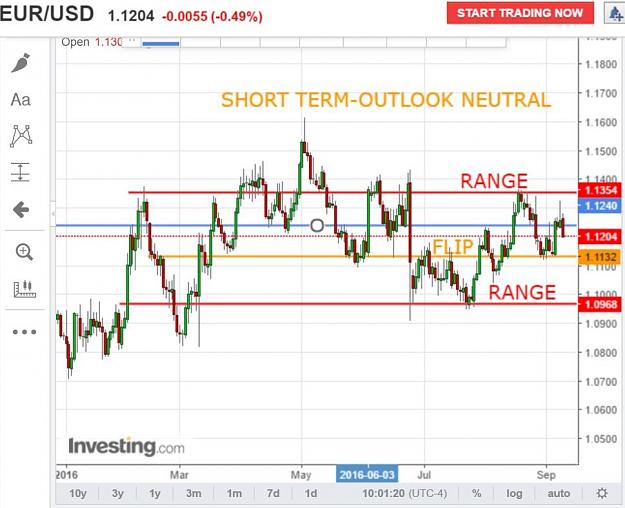
- IMARICH1 replied Sep 9, 2016
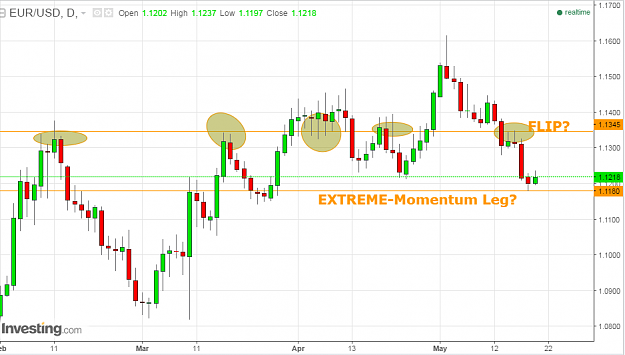
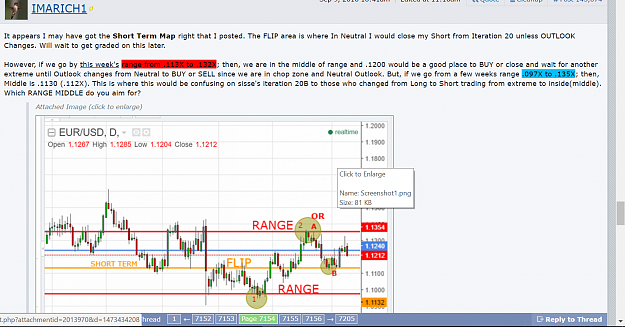
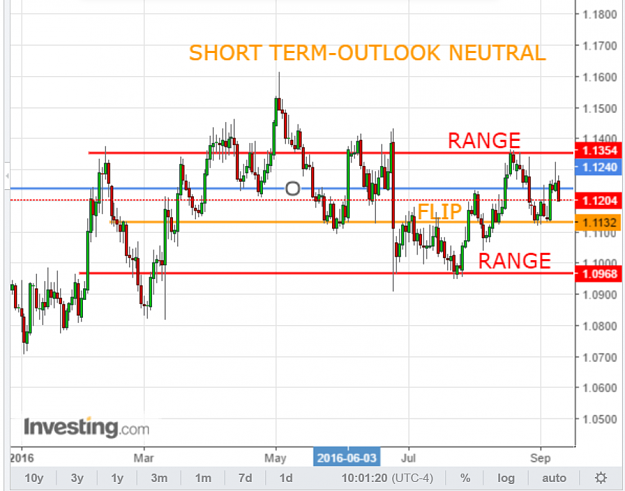
It appears I may have got the Short Term Map right that I posted. The FLIP area is where In Neutral I would close my Short from Iteration 20 unless OUTLOOK Changes. Will wait to get graded on this later. However, if we go by this week's range from ...
The Really Useless Thread
- IMARICH1 replied Sep 9, 2016
Show and Tell Time..... I show and sisse TELLS.........
The Really Useless Thread
- IMARICH1 replied Jun 23, 2016
[quote=sisse;8995909] Can I ask you back a question just to tease you: What do you think are the odds of the current levels being a wick in the W candle and that the W roll around the 20th close? ... i think is the 4th time I ask you this in similar ...
The Really Useless Thread
- IMARICH1 replied Jun 20, 2016
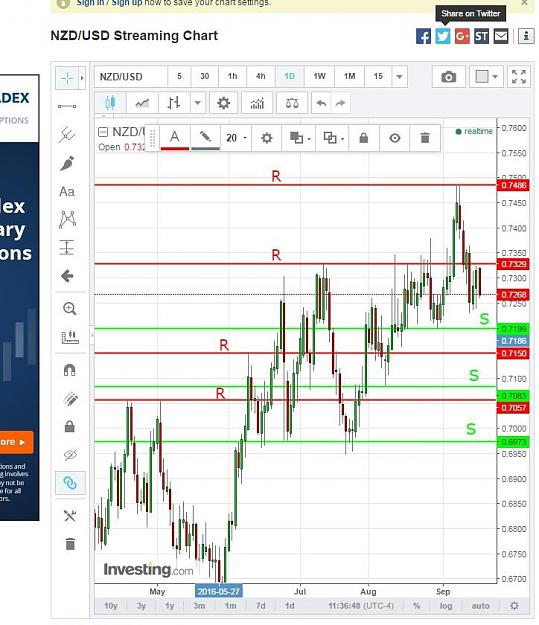
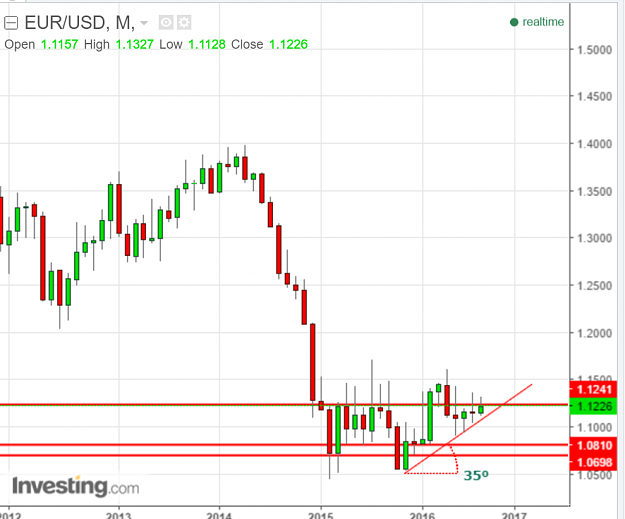
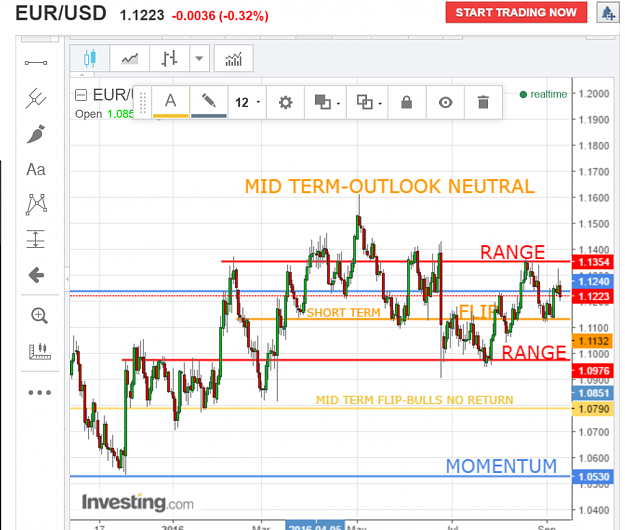
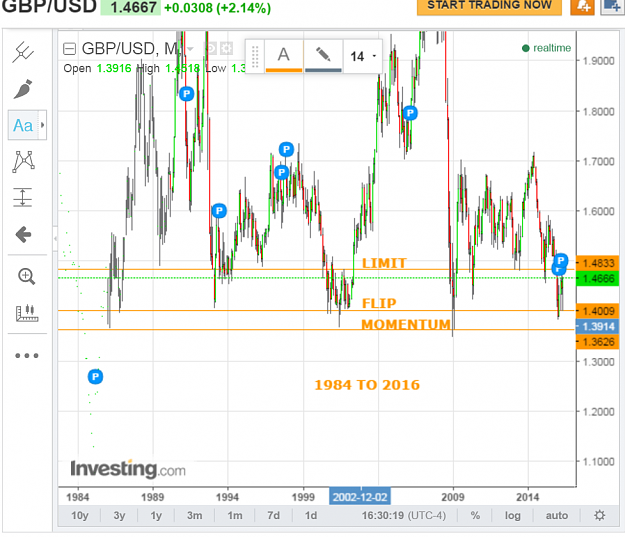
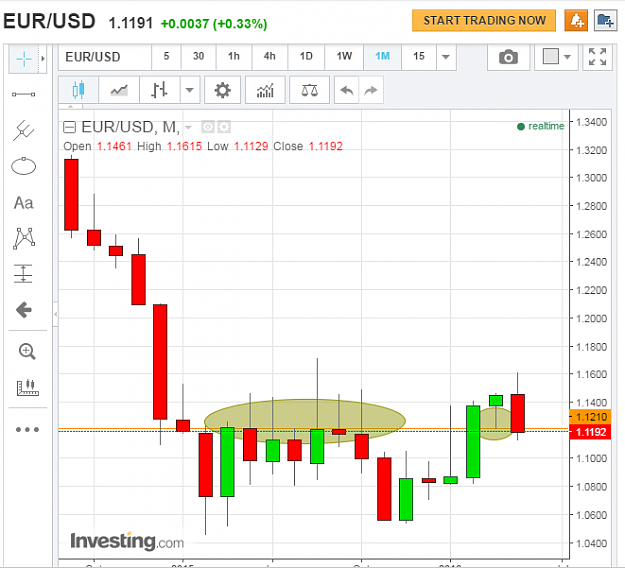
Honestly, I don;t think I know how to MAP a Short term Map, MID Term and Long Term Map due to ignorance in swings and legs still. I made this MID Term MAP looking at the past 30 yrs since you indicated Sterling may see LOWS its never seen for a very ...
The Really Useless Thread
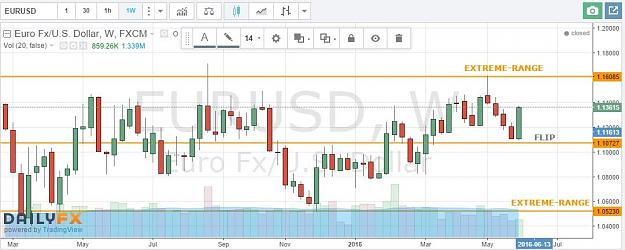
- IMARICH1 replied Jun 20, 2016
I would presume this is what you would post to me (sisse) as this was a question I wanted to ask you and would have caused you to have an early week melt-down with me. But, I want others to see how easy it is to doubt from one week to the next and ...
The Really Useless Thread
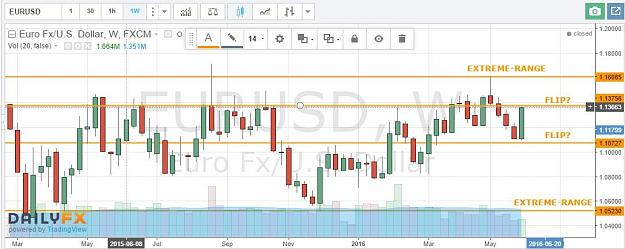
- IMARICH1 replied Jun 3, 2016
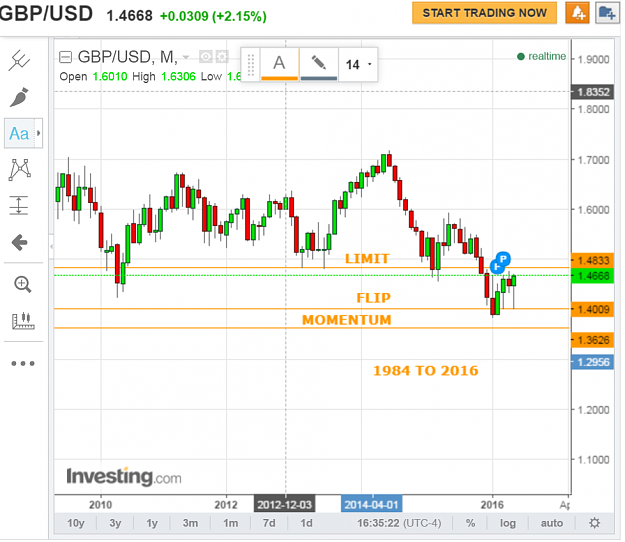
Here is my take on it. At first I had my range from our current Low (.109X) to Current High (.161X); but, that would be more for a Daily Chart or Short Term range as opposed to MID Term range. I corrected it and here is what I came up with.
The Really Useless Thread
- IMARICH1 replied May 26, 2016
Thanks and I know you were NOT directly referring to me; but, I do get to close alot of times to my charts and was wondering if I was again. I was watching for .1215/18 not to be taken as its a S and R on Daily Chart. I believe .124X is even ...
The Really Useless Thread
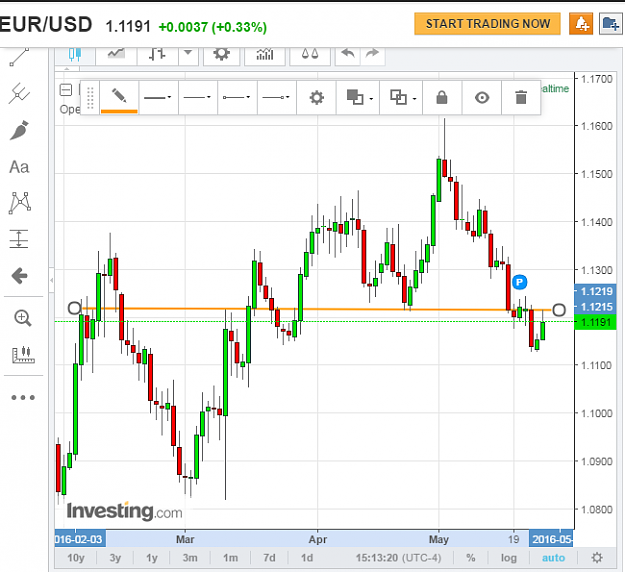
- IMARICH1 replied May 21, 2016
EDIT: This was my ORIGINAL answer: If my OUTLOOK is SELL then: a. Around the green area (an Engulfing candle from top to bottom) -> A close below the last candle low If my OUTLOOK is NEUTRAL then: b. Around the orange area (an Outside candle with ...
The Really Useless Thread
- IMARICH1 replied May 20, 2016
"Are you still unclear with the chart in this conversation? and why we stop 1.117x? I hope not ..."-sisse For the sake of learning, I will answer and be scolded due to ignorance....... "In an outlook sell (or buy) whatever the chart, the break of ...
The Really Useless Thread