- Search Crypto Craft
- 12 Results
- Forthebulls replied May 11, 2017
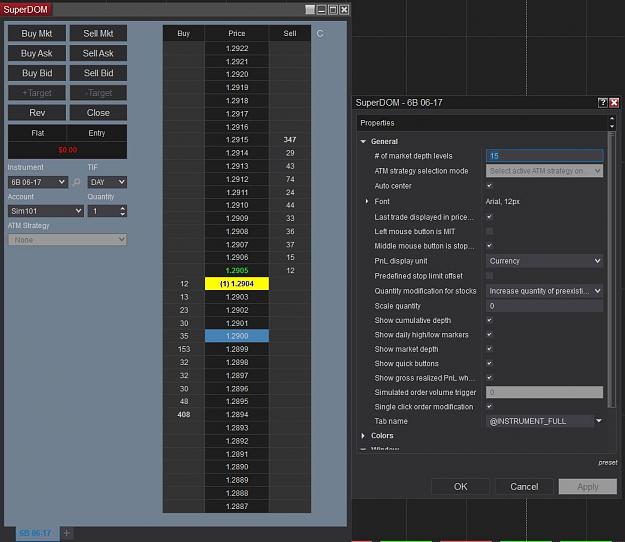
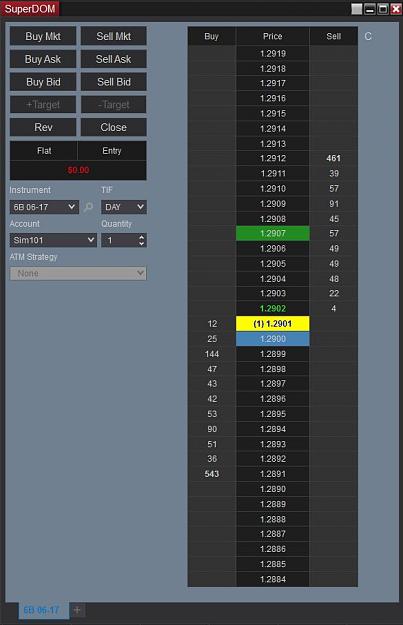
Do you trade with a DOM? Do you realize that this ladder of limit orders is what smart money uses to steer the market? Look at the DOM attached, what will happen when 1 market buy fills, what will happen when 1 market sell fills? Since there is a ...
Ratios & Harmonics: a Different Way to Trade

- Forthebulls replied May 11, 2017
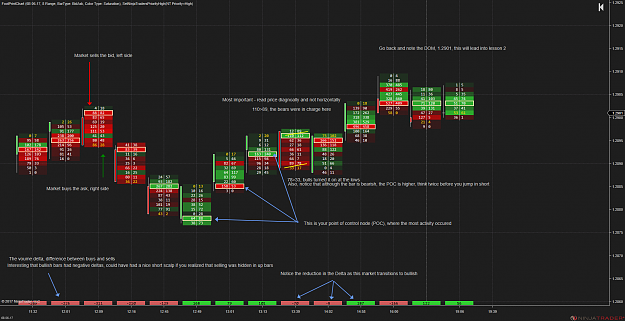
I will do my best to convey the basics, but I am 10 years removed from school so my teaching skills may be rusty. Reading the tape: There is a ton of info to take away from the footprint, I will be using 6B as an example since the currency futures ...
Ratios & Harmonics: a Different Way to Trade
- Forthebulls replied May 9, 2017
Hey Damian, nice to see you implementing a footprint chart. If I can add two things that may make it more helpful: I do not use a footprint with time or tick charts, it gets unmanageable. To me range bars are best... depending on the instrument try ...
Ratios & Harmonics: a Different Way to Trade
- Forthebulls replied May 2, 2017
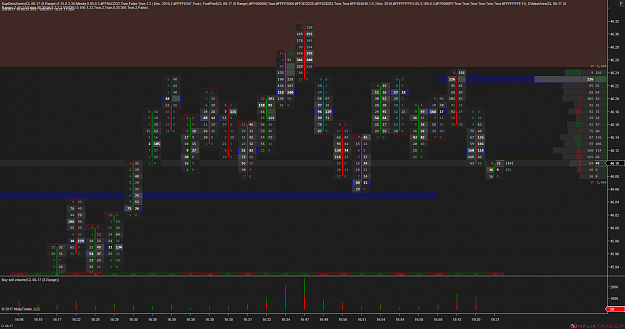
Hey Wiz, I scalp a bit differently, but it is volume/order flow base. Since I only trade futures now, forex traders may not have access to charts like this. But it really gives you a deep dive of how market orders are filling against bid/ask limit ...
Wiz Index
- Forthebulls replied Apr 28, 2017
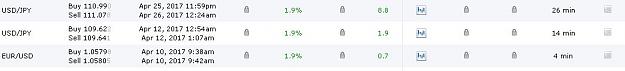
Wiz, one other question for you too: Looked through some of your trades, winners & losers; seems you run very deep stops for many trades. So how do you evaluate your R:R, Stop loss (if you're using one), and decide on a losing trade before closing ...
Wiz Index
- Forthebulls replied Apr 25, 2017
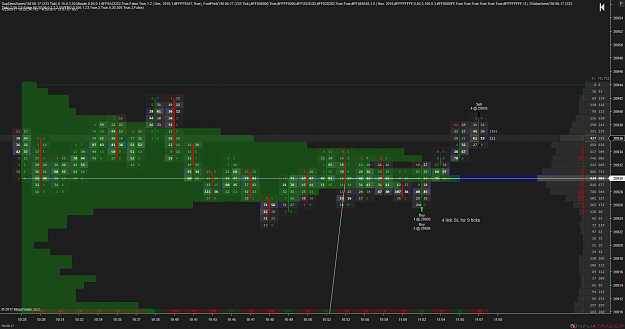
Took the morning off to trade YM with Mr. Pip. Not much going on but I was able to grab 9 ticks with my footprint chart.
Ratios & Harmonics: a Different Way to Trade
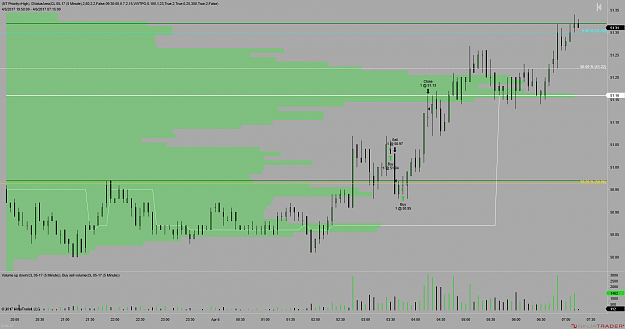
- Forthebulls replied Apr 12, 2017
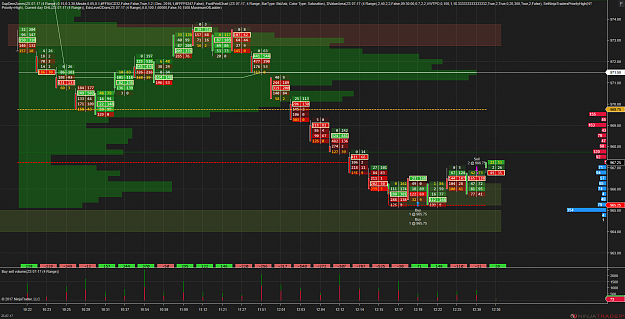
The market hasn't been ideal for this type of analysis over the past two weeks... I had to go back to April 4th to find a good example. Again, this is just the way I see the swings on a 15 minute chart, others might interpret them differently ...
Ratios & Harmonics: a Different Way to Trade
- Forthebulls replied Apr 6, 2017
Sure, it's the DValueArea from futures io for NT8. To access their indicators and addons you do need to pay a $100 lifetime membership. But they have other nice tools like footprint charts and supply demand zones. Some of these would cost you over ...
Ratios & Harmonics: a Different Way to Trade
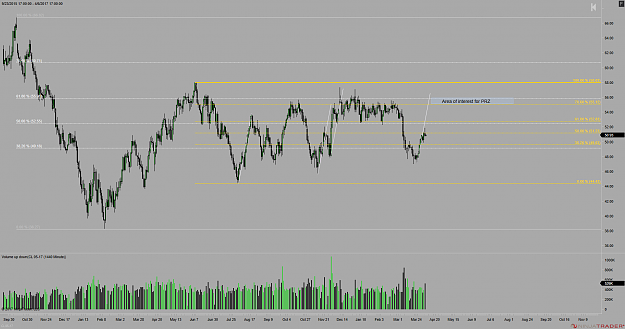
- Forthebulls replied Apr 5, 2017
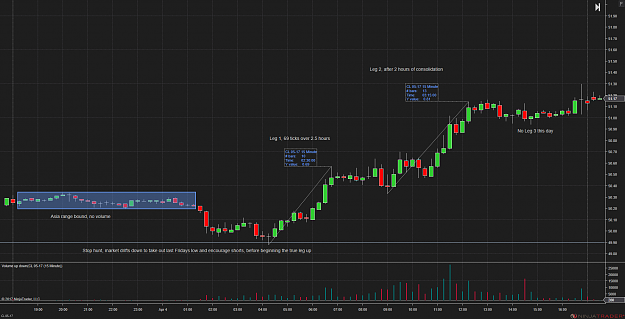
I use the daily chart to determine a directional bias. Right now I am actually bullish, one thing to note about oil: historically it is bullish April and May due to pump demand (spring break travel season). There was a nice drop today with inventory ...
Ratios & Harmonics: a Different Way to Trade
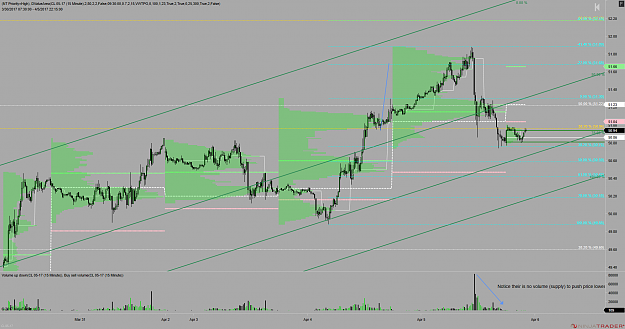
- Forthebulls replied Feb 25, 2017
Hello Lundies, Something to think about... You would be buying close to a supply zone, will the market still find imbalance here or has the zone been consumed? I would not be comfortable taking that trade on a 30 minute chart. Attaching a chart with ...
Ratios & Harmonics: a Different Way to Trade
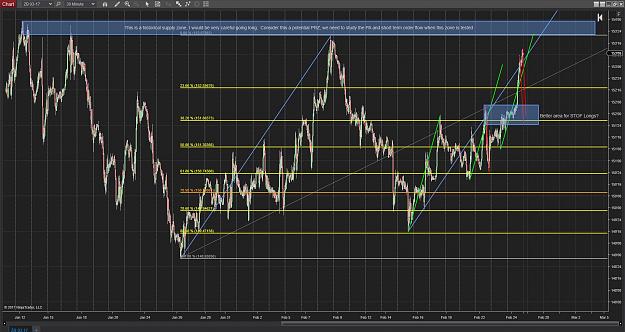
- Forthebulls replied Feb 24, 2017
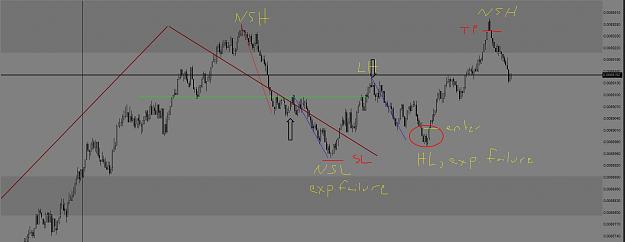
Hello X3m, Nice charts. I would have considered entry around 89010 with stops around 8893 expecting 8925 to be broken for a NSH and approximately a 1 to 1 R:R. Adding a snip, excuse the MS Paint markings.
Ratios & Harmonics: a Different Way to Trade
- Forthebulls replied Feb 21, 2017
Morning traders, Ninjatrader question for anyone who can help. I have moved away from FXCM to Ninjatrader and am currently using the Free direct version. However, it seems they won't allow me to associate a SL or TP with the ticket? Am I missing ...
Ratios & Harmonics: a Different Way to Trade

- Posts by Member Search: 'Forthebulls'