- Search Crypto Craft
- 18 Results (1 Thread , 17 Replies )
- Drawdown %, Pip-Drawdown, Cash value, % change.What about it!?Started Jun 13, 2014|Commercial Content|0 replies

Good evening everyone, Please take the time to provide an answer, in which you speak about which if ...
-
 FibsWork4Me replied Jun 9, 2014
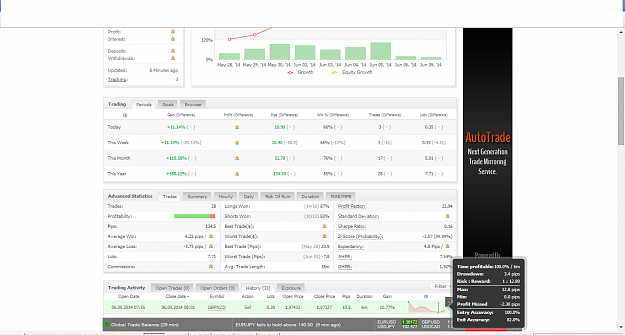
The following snapshot is the perfect example of pip quality over quantity. image Do you see the small box towards the lower right hand side of your screen? You may have to download the picture then zoom in. The time which I spent profitable was ...
Difference between Pip Quantity vs Quality
- FibsWork4Me replied Jun 9, 2014
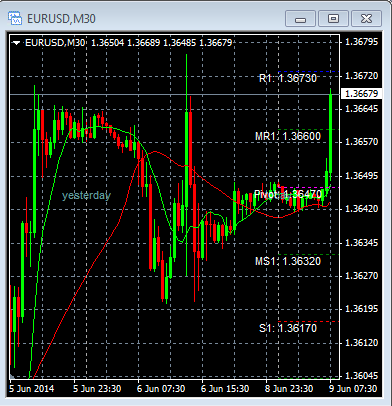
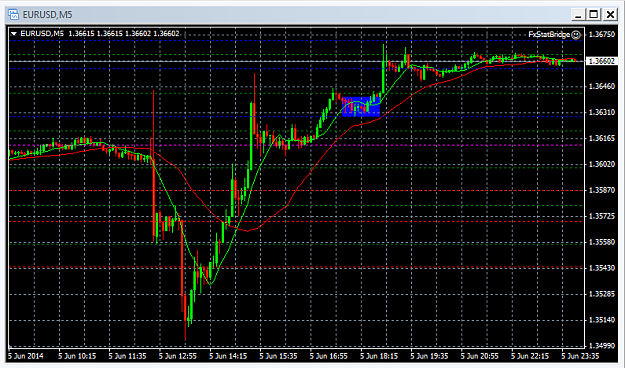
Here is a nice chart for those of you who are new to forex. Most of the times people call support and resistance, not realizing that past support/resistance is today's pivot level. Have a look at the following picture of E/U You can see last week's ...
EURUSD
- FibsWork4Me replied Jun 6, 2014
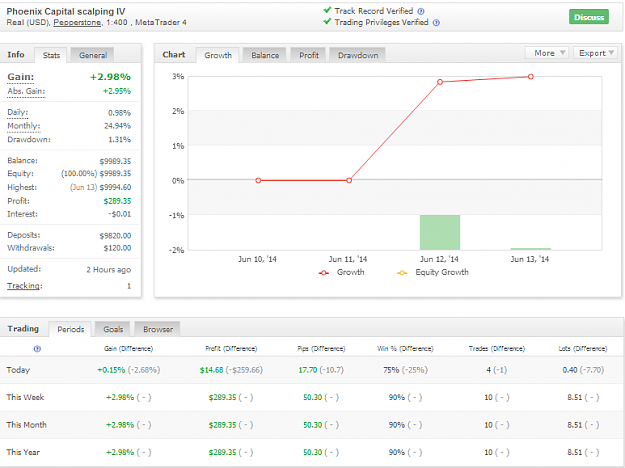
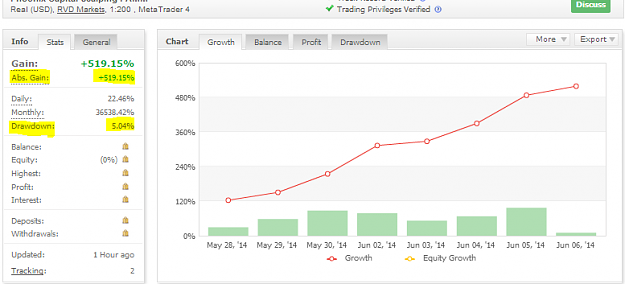
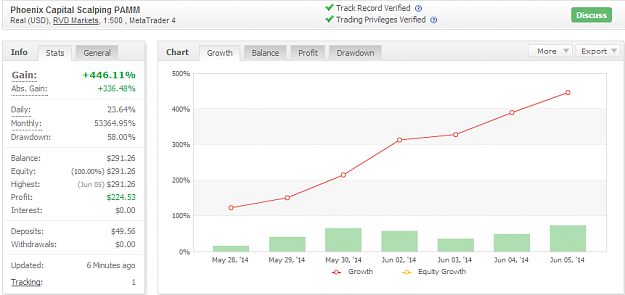
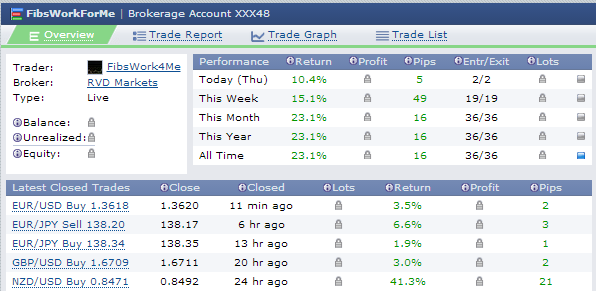
Most people tell you that a high draw down % is due to trading at high risk. Well how does 519% profit with less then 6% draw down sounds? It only be explained by the entries of each order being the turning point of a trend. What ever tf it is. So ...
Difference between Pip Quantity vs Quality
- FibsWork4Me replied Jun 5, 2014
I just wanted to take this time to update you to my system. Since taking over an account, we have been able to get over 400% profit, with DD% of less then 10%... YES..... 10%:51: Hard work, and discipline is how returns and stats like the ...
Difference between Pip Quantity vs Quality
- FibsWork4Me replied Jun 5, 2014
I have a question. We clearly have a "cup and handle" formation on EU. Now the last 5 times this formation was confirmed. What was the next move? "extension or reversal? image
EURUSD
- FibsWork4Me replied Jun 4, 2014
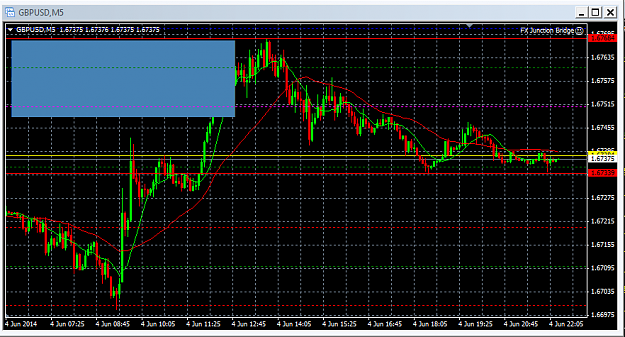
Good evening all... The top red line is the price of CABLE when the news event was made public. You see the run up before the news, well this 30 pip drop+ is those people taking profit. Trading news, is for quick pips... 30+ 40 pips. You simply need ...
Cable Update (GBPUSD)
- FibsWork4Me replied Jun 4, 2014
Since usd DATA you can see GBP pairs (expect gbp/usd) HAS PULLED back.
Cable Update (GBPUSD) image
image
- FibsWork4Me replied Jun 4, 2014
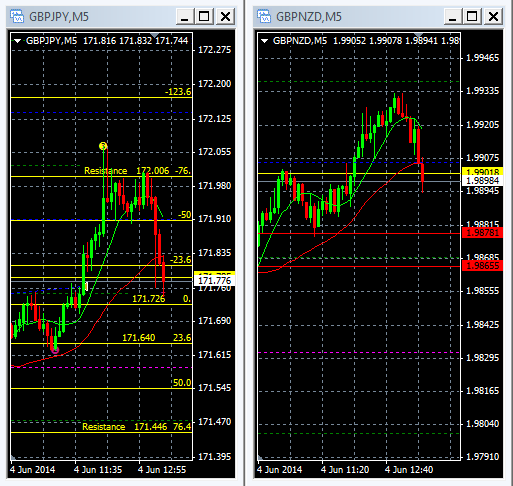
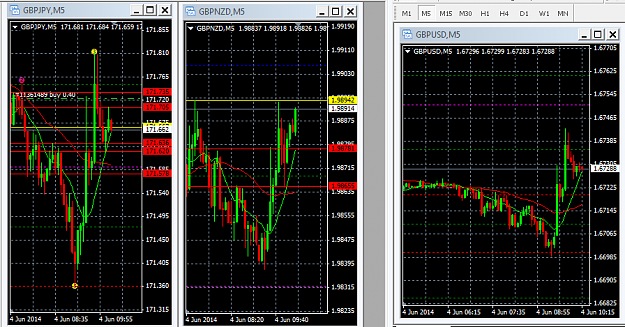
Here you can see the three GBP pairs I am watching. GBP/NZD appears to want to break the news high, but GBP/JPY AND GBP/USD keeps falling away from it. image
Cable Update (GBPUSD)
- FibsWork4Me replied Jun 2, 2014
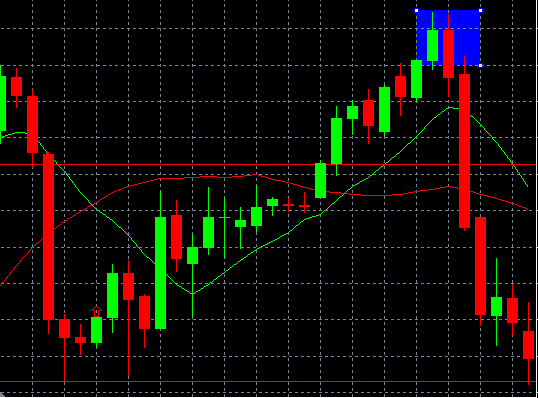
After the green candle engulf the blue box is the shows the first engulf of a green candle.
Difference between Pip Quantity vs Quality Over 55 pips
  image
image
- FibsWork4Me replied May 30, 2014
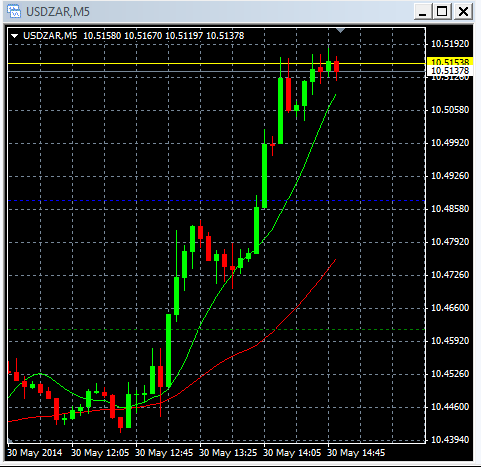
image The spread is horrible, but it appears to have some very good price action. Thank you citiboy for sharing. I'll have to study that pair and see if it is worth scalping. All I want are some runners.
EURUSD
- FibsWork4Me replied May 29, 2014
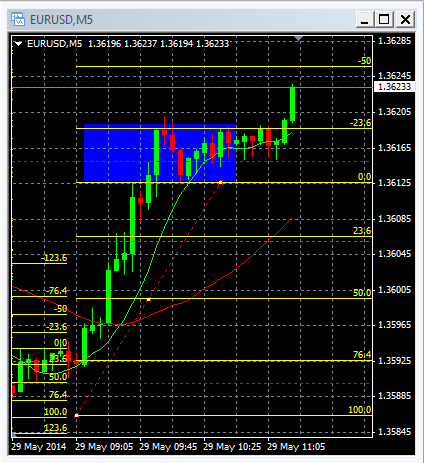
Cup and handle formation looks to want to form on EU if you zoom out on your 5M chart. This typically results in accumulation. So we should see a range either at 1.36255 pivot or 1.3615 pivot. A spike up from here would be unexpected. I was long and ...
EURUSD
- FibsWork4Me replied May 29, 2014
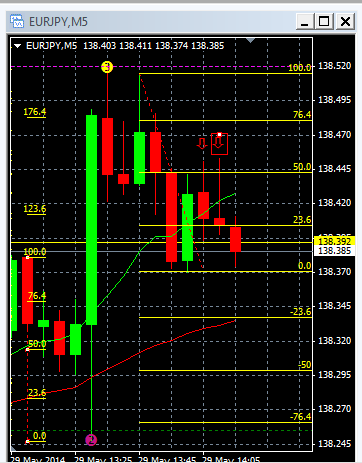
You can see the two arrows on the EJ chart. We have had two rejections from that price. A close across that price would be a good price to go long for an extension of this run. The 100.00 fib level is the high of the last spike, and the 0.0 fib is ...
EURUSD
- FibsWork4Me replied May 29, 2014
image The arrow shows the high created by the news. You can see EJ is still right near the pivot. While EU bounced off of the pivot and is now trading at the MR1 pivot. Should EJ stay where it is, and EU make a move upward then we should have a ...
EURUSD
- FibsWork4Me replied May 29, 2014
Would you please explain to me how does my line tell me to sell? P.S. Have a look at the chart once again. Have you noticed that not one of the green candles were engulfed within that fib range. Taking a sell before an engulf is taking a position on ...
EURUSD
- FibsWork4Me replied May 29, 2014
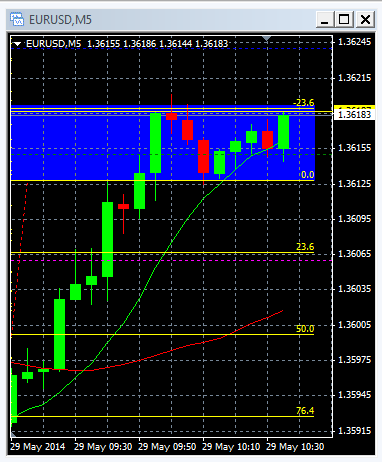
Should we get any engulfing of a bull candle within the highlighted zone. I would take a rather large scalp sell on EU. Until then I will respect the accumulation we are seeing between this fib level.
EURUSD
- FibsWork4Me replied May 29, 2014
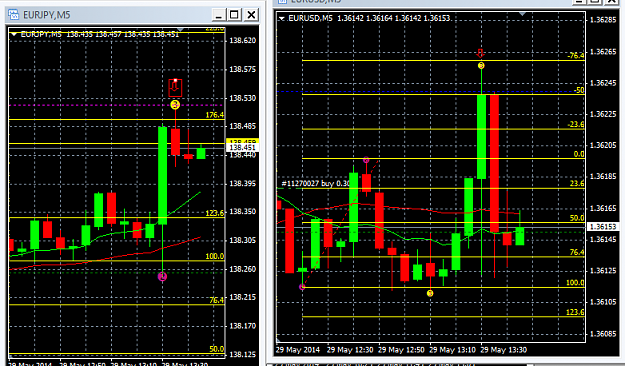
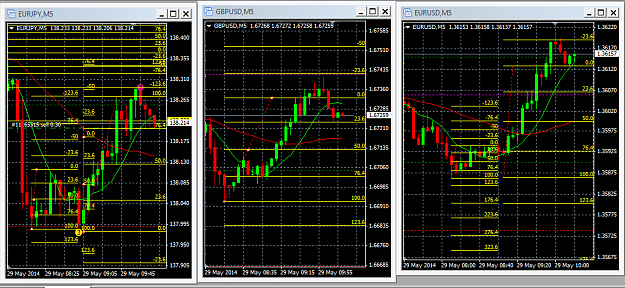
Good morning all. It appears that all three of the currency pairs which I am watching, including EUR/USD have rejected off of the -23.6 fib level after the last retrace. Should EUR/USD close across the -23.6 fib level (on 5m chart) then I would head ...
EURUSD
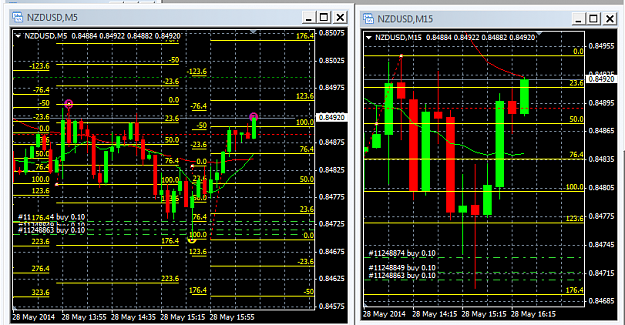
- FibsWork4Me replied May 28, 2014
image Hello all. I am a fib scalper. If you look at the 15 min chart which I have posted. If NZD can close over .8491 on then the Bulls will have the advantage in a possible 2 pivot retrace. You can see I longed on the 176.4 reversal, and ...
NZD/USD
- Posts by Member Search: 'FibsWork4Me'