- Search Crypto Craft
- 3 Results
- Draxander replied Sep 24, 2020
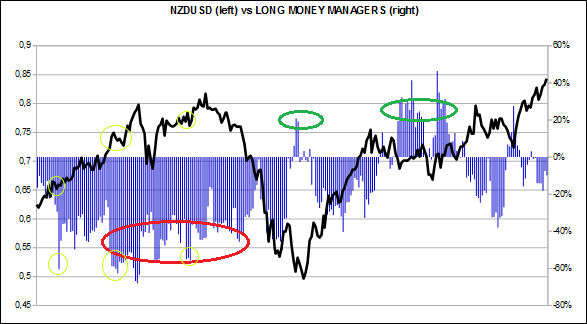
If you look at the yellow circles, it shows extremes in the Long Money Managers and a bearish price movement is anticipated. If a short trade is entered at that point, the next bullish movement would have taken out the stop loss.
FX investing: mid/long term ideas
Attached Image
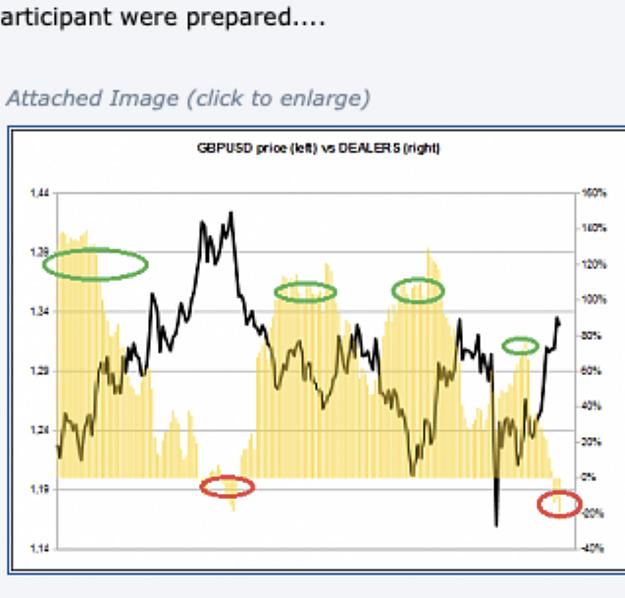
Attached Image (click to enlarge)
- Draxander replied Sep 10, 2020
Hello Kuroro, I have plotted the dealer data on my price chart in comparison to your chart with dealer data in the first image. it does not look the same, may I ask how can I get it to look like yours?
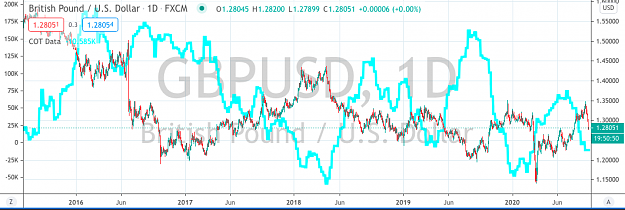
Cable Update (GBPUSD)
Attached Image (click to enlarge)
- Posts by Member Search: 'Draxander'