- Search Crypto Craft
- 57 Results
-
 Coondawg71 replied Feb 19, 2016
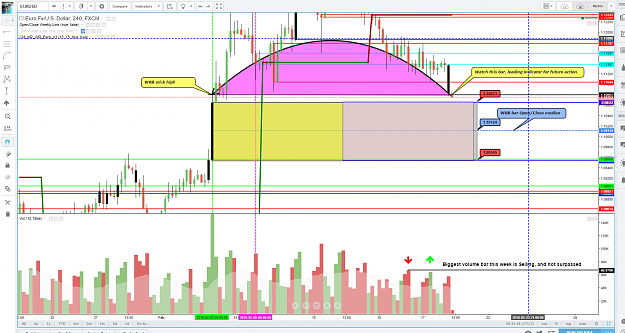
continued, we see price worked within the last WRB top and bottom. The first bar after the WRB closed up, inside the WRB, indicating retracement price action to follow. sjc image
Commit to the Trade
- Coondawg71 replied Feb 18, 2016
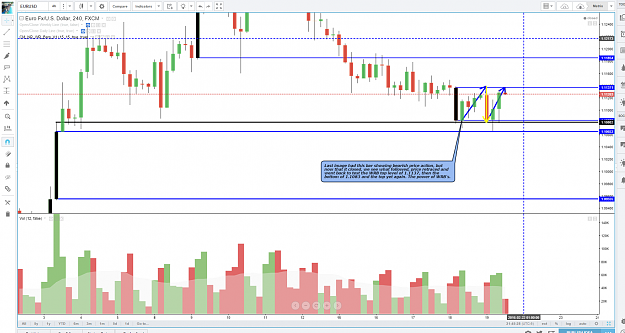
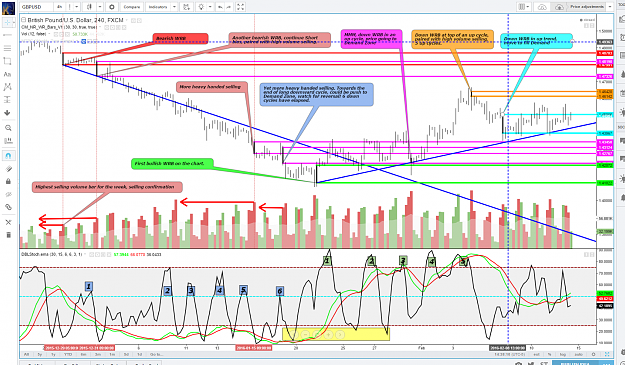
continued.... We see that the bar indeed closed lower and actually became another WRB. Downside targets remain. I'm still working with/learning how to utilized WRB best, you will see there is an additional support/resistance level added on the WRB ...
Commit to the Trade
- Coondawg71 replied Feb 18, 2016
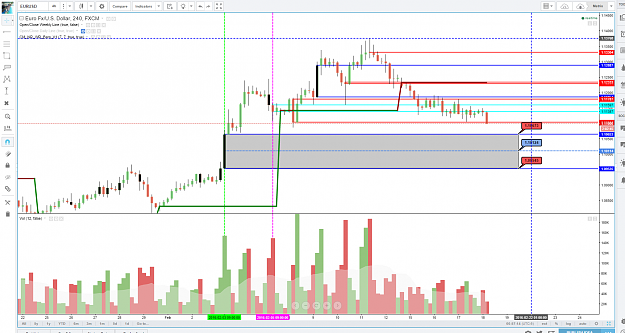
@ TraderinSD, Thanks! Here I have a EuroUsd 4 hr chart. I see some obvious targets below offered by a WRB from the prior weeks. I add a median (dashed blue horizontal). Very interesting price action in the recent past: something you have mentioned ...
Commit to the Trade
- Coondawg71 replied Feb 17, 2016
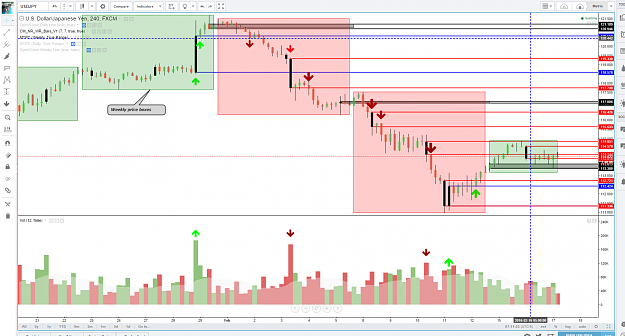
@TraderinSD, Here is how I see how to read a chart with WRB: 1. WRB draw my attention to a specific point in price action. The WRB is either a move to Supply/Demand or a repricing of an Fx pair after a high impact event. 2. I mark the open and the ...
Commit to the Trade
- Coondawg71 replied Feb 13, 2016
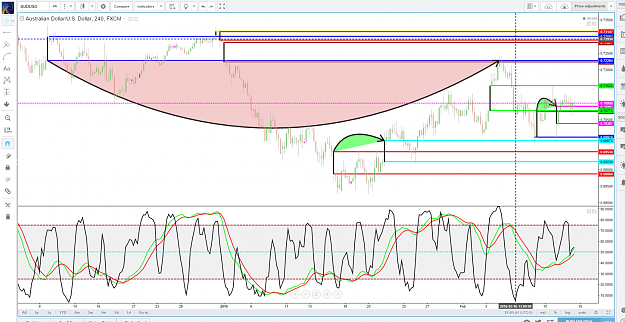
@TraderinSD, Another chart that is offering some great points of interest, AudUsd. sjc image
Commit to the Trade
- Coondawg71 replied Feb 13, 2016
@TraderinSD, Great thread you have created. This is the way I wish knew how to trade BEFORE I actually started "trading"/losing my funds years ago. Keep up the great posts and education of how retail traders should be looking at price action. Since ...
Commit to the Trade
- Coondawg71 replied Mar 18, 2015
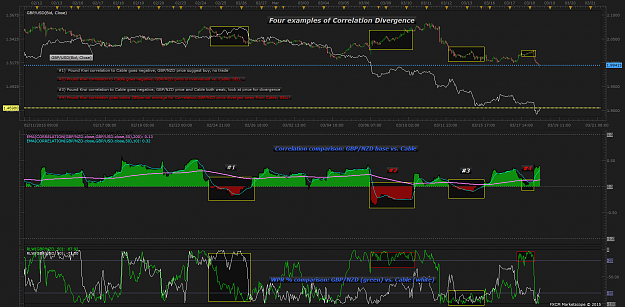
image This is probably obvious to some, but I did a comparison of GBP/NZD vs the Cable using a Correlation indicator. Negative divergence of GN away from positive correlation shows up in a pretty obvious fashion via the indicator and price. Also ...
(binned per thread starter’s request)Asian and London Section In
- Coondawg71 replied Mar 18, 2015
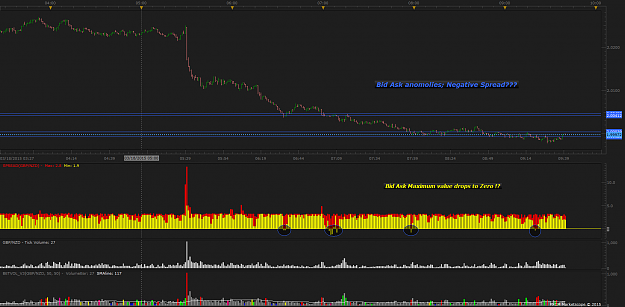
image Interesting anomaly....negative Bid Ask spread minimum, Bid Ask spread maximum drops to zero....yet last two instances volume values registers these price bars as selling. Obvious algo driven mark downs?
(binned per thread starter’s request)Asian and London Section In
- Coondawg71 replied Mar 18, 2015
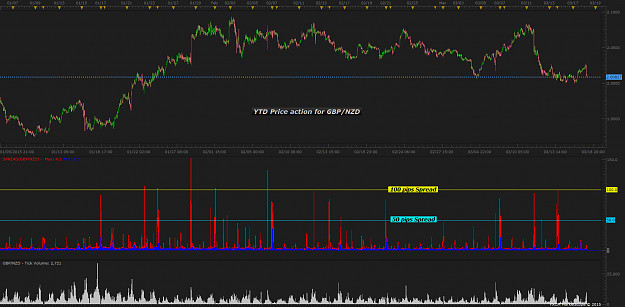
image Perhaps this will help explain what I am referring to...Spread aka difference between High and Low of pips within a price bar VS. Spread of Bid price and Ask price of said price bar that your respective broker charges for entering the market ...
(binned per thread starter’s request)Asian and London Section In
- Coondawg71 replied Aug 26, 2014
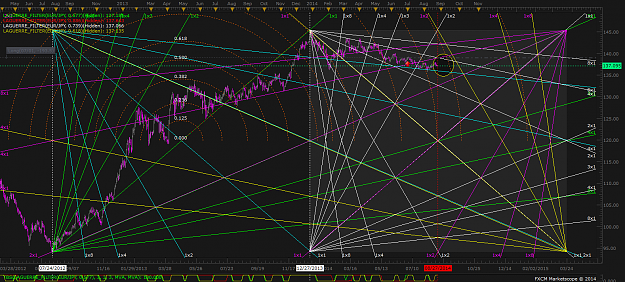
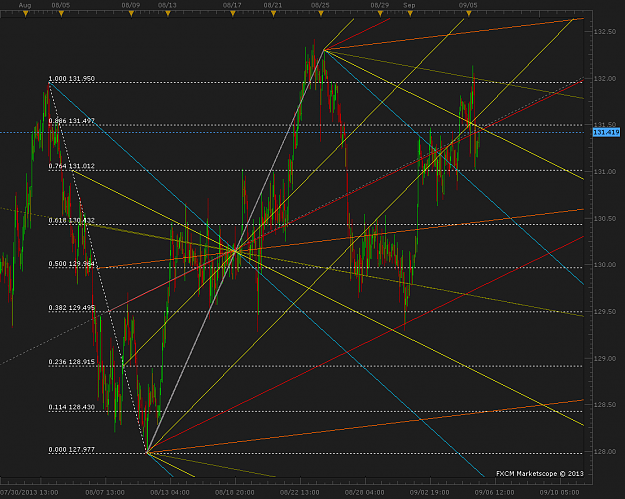
I see tomorrow as being a pivotal point for Time and Price on the EurJpy. I drew a box from the low point of 07/24/12 (point A) to 12/27/13 (point b) and drew my gann fans from each corner of this first box. I then copied this box and shifted it ...
Gann Analysis
- Coondawg71 replied Sep 5, 2013
See! I knew at least Kap may have ventured down that path. I just am not well versed in forks to know any better, but if plotting a Schiff and Mod Schiff prove useful than the other ratios obviously have relevance as well. The interesting thing I ...
Andrews Pitchfork (Median Line)
- Coondawg71 replied Apr 17, 2013
Hope you don't mind, I'd like to offer a chart with Schiff pitchforks. Perhaps it will offer some price action guidance. sjc
Geppy's Geppy Thread (GBP/JPY)
- Coondawg71 replied Apr 17, 2013
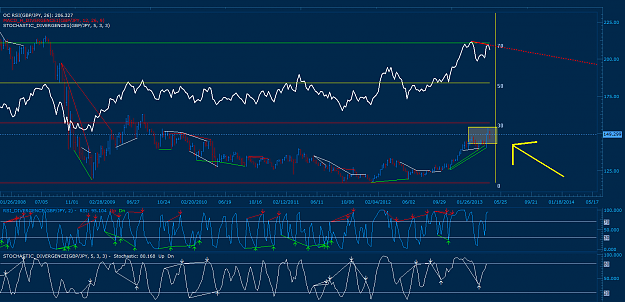
Does anyone see a weekly RSI divergence?!? ...with the possibility of dropping to 146.50??? I see the Weekly 26 period RSI pulling downward. This would be forming the head and shoulders (I never care to talk/trade in regards to patterns but that is ...
Geppy's Geppy Thread (GBP/JPY)
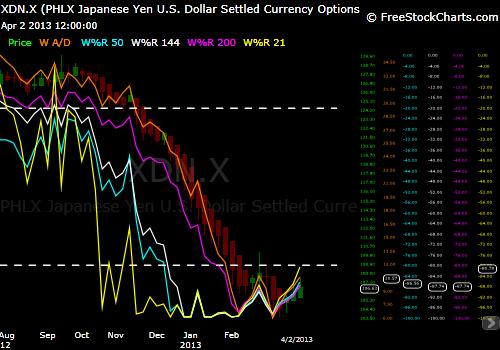
- Coondawg71 replied Apr 3, 2013
Obviously I know they don't carry has much as the cash market itself, but it is interesting to see that there is a market on the other side in a different arena per se. They both are showing good momentum pro Yen are larger time frames. Pic not the ...
JPY Cross Pairs
- Coondawg71 replied Mar 30, 2013
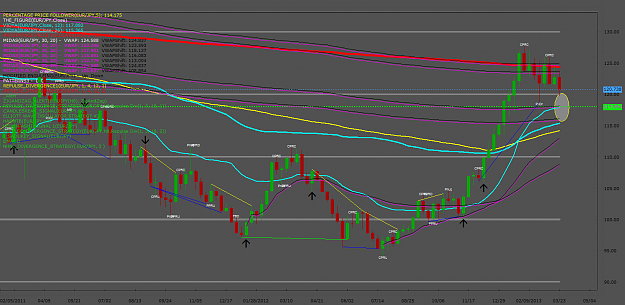
I see a strong point of Value @ 118.00 for Euro Yen on the Weekly price chart. Confluence of a Quarterly Vidya average and a VWAP from the July 2008 High leads me to believe this will be touched soon enough, days or the coming week or two. This will ...
JPY Cross Pairs
- Coondawg71 replied Mar 16, 2013
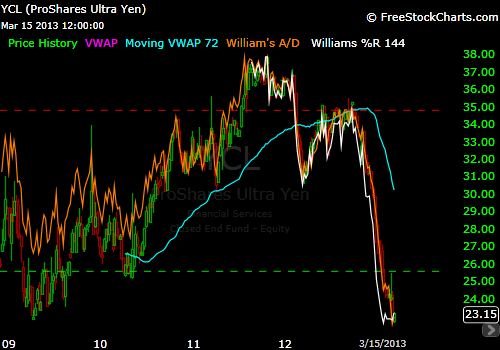
YCL Weekly shows quite a lot of room to work with to either side, Buy or Sell. sjc
JPY Cross Pairs
- Coondawg71 replied Mar 16, 2013
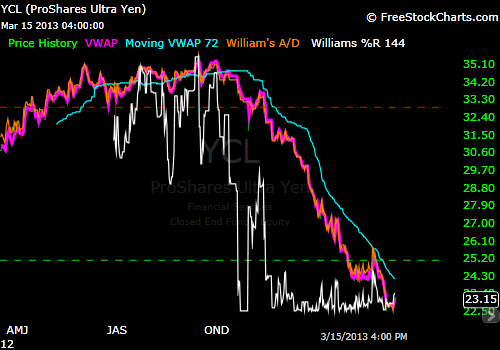
Here is a perspective of Yen value versus a Currency Trust, The Proshares YCL on a 4 hour chart. Could be some more retracement (Yen Strength) until we reach a point of True Value (VWAP and Moving VWAP) then a resumption of the overall trend. I am ...
JPY Cross Pairs
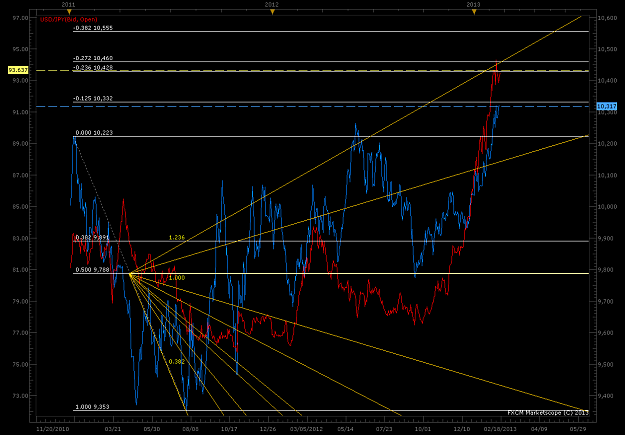
- Coondawg71 replied Feb 17, 2013
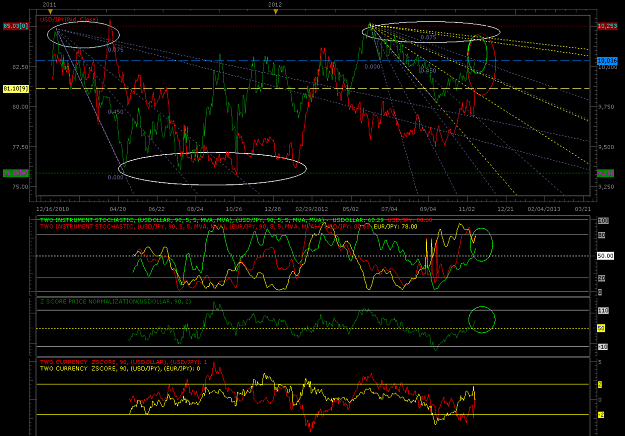
In reference to the continuing trend of US Dollar strength (due of course to the prevailing trend in JPY weakness), I see the FXCM US Dollar Index continuing through to 10,428 which in turn will lift the USDJPY pair upwards to 96.00. That is IF will ...
JPY Cross Pairs
- Coondawg71 replied Feb 17, 2013
My perspective for the first three days of the trading week will be bearish with 1.3265 as a price target. sjc
EURUSD
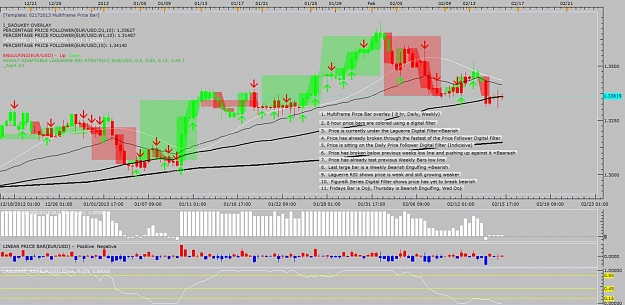
- Coondawg71 replied Feb 17, 2013
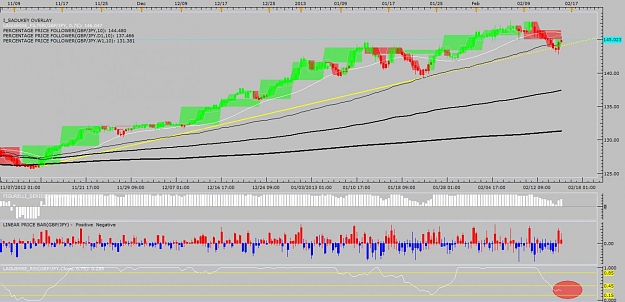
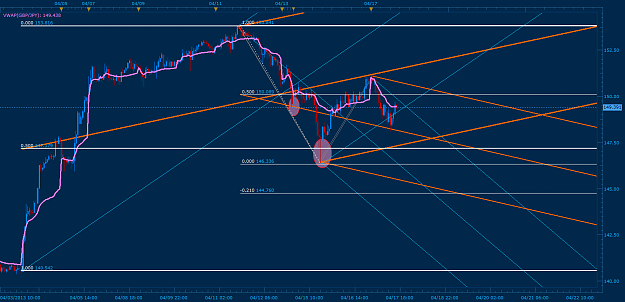
I did a little work with some digital filters in order to get some perspective from this past weeks "action". My initial bias on this particular pair is a bearish move to the VWAP of 144.30 before resuming upwards. If the price on the starts holding ...
JPY Cross Pairs