- Search Crypto Craft
- 10 Results
-
 BillGates replied May 7, 2016
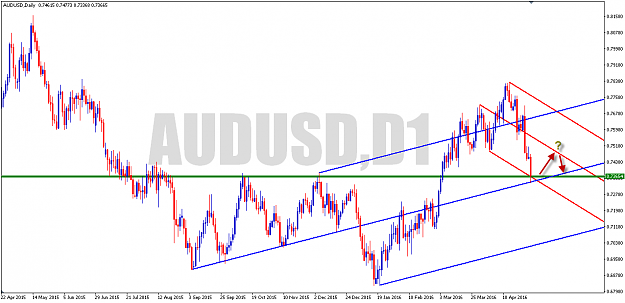
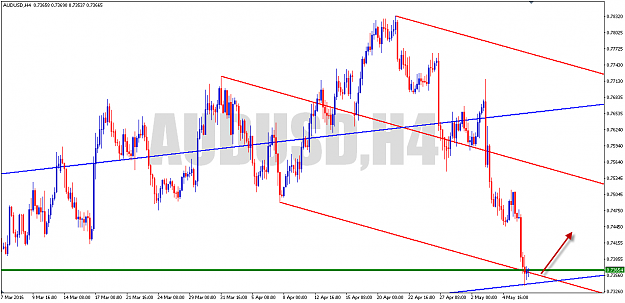
looks like the price will bounce up on the energy point/confluence level. What do you think.. image image
The One: Price Action and Reaction
- BillGates replied Apr 9, 2009
The 1.3360 and 1.3415/25 levels are coinciding with the horisontal lines generated with gann grid.
EURUSD
- BillGates replied Apr 8, 2009
Most platforms provide fibo fan. Put the fibo fan at the lowest (or highest) point. If you are using MT4 platform, you can adjust the lines by double clicking the red dot line. The cross of fibo fan lines and any trend line can sometimes setup a ...
EURUSD
- BillGates replied Apr 8, 2009
Looks like it respects the 76.4 line of fibo fan and monthly pivot:
EURUSD
- BillGates replied Sep 16, 2007
need more explanation — Looking at the charts below, I still confused with the COT chart, or are they the correct ones? The commercials are still shorting euro but the chart shows uptrend price. SeekingLight, I am seeking light...
Another way to trade PA profitably
- BillGates replied Jul 27, 2007
Perfect setup — The William's Percent Range of M5, M15 and H1 charts are all heading up. Most of the time, you will get better entries using M5 chart provided that the other two charts have the same direction.
Tenno system
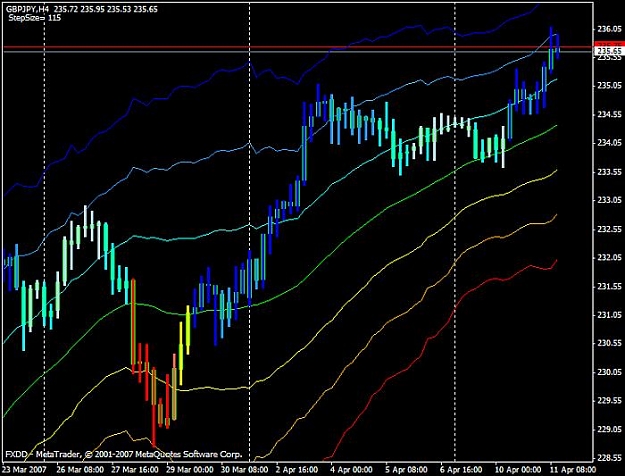
- BillGates replied Apr 11, 2007
Different brokers different colors — I'm trading with IBFX and FXDD. Their MT4s produce different colors. In this case, FXDD's MT4 has similar colors to pabloski's chart colors.
pabloski System
- BillGates replied Sep 30, 2006
more recent demand line — I think the projection price from the more recent trend line is more realistic.
Mouteki Trading
- Posts by Member Search: 'BillGates'