- Search Crypto Craft
- 331 Results (1 Thread , 330 Replies )
- AlistairC replied Mar 26, 2024
======================== Summary of the below (the short answer): The ideal trigger candle is one that takes place after a pullback and not too far from the origin of that trend. ======================== I can explain where I will enter using a ...
MA Crossover System that works for me
- AlistairC replied Mar 25, 2024
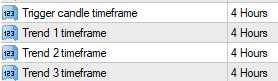
There is always more to learn! I realised that the trigger candle concept is more useful than I originally thought. This is the concept that eurusd-thijs used for his EA that he very kindly made public on this thread. In the EA I have it set to send ...
MA Crossover System that works for me

- AlistairC replied Dec 7, 2023
Even though we've kind of signed off on this thread, I feel I have to comment on what I'm seeing in the forex markets. It seems big shifts are taking place with almost no trading opportunities using the 3x3 method (3 EMAs aligned across 3 TFs), and ...
MA Crossover System that works for me
- AlistairC replied Oct 31, 2023
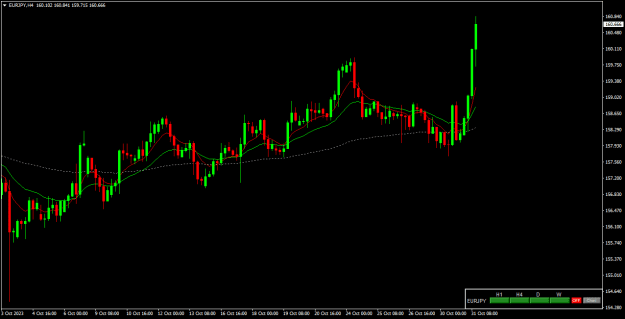
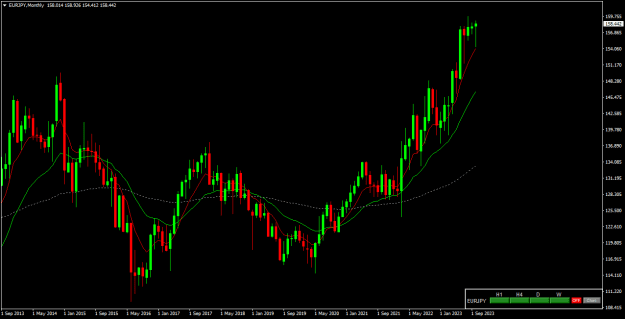
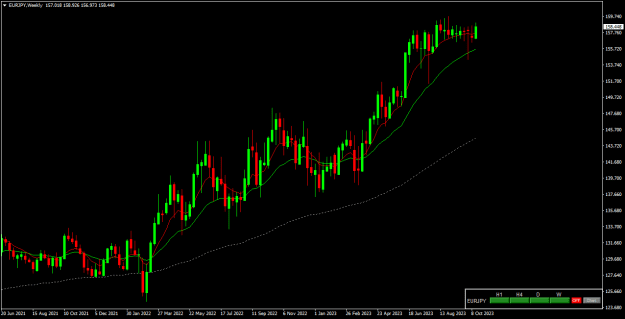
I hope I didn't persuade you to get out of your long-term trade. EURJPY has taken off! image
MA Crossover System that works for me
- AlistairC replied Oct 26, 2023
I have had a good last two days so far - 3 winners, one closed manually for a small profit and no losers. I have just checked gains since 1 September - account balance increased by 16%. That's mainly using the 3x3 method or variations of that. This ...
MA Crossover System that works for me
- AlistairC replied Oct 25, 2023
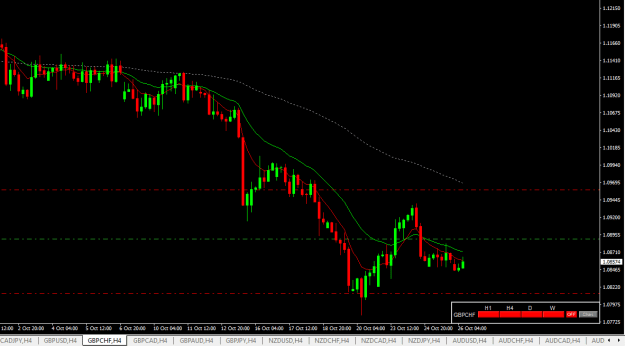
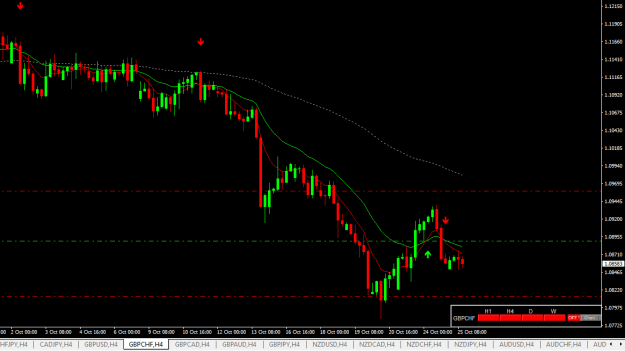
I entered this GBPCHF trade yesterday. It dropped nicely but has now gone into consolidation mode. Hopefully not for too long and hopefully it will explode out of that soon and reach the target
MA Crossover System that works for me image
image
- AlistairC replied Oct 24, 2023
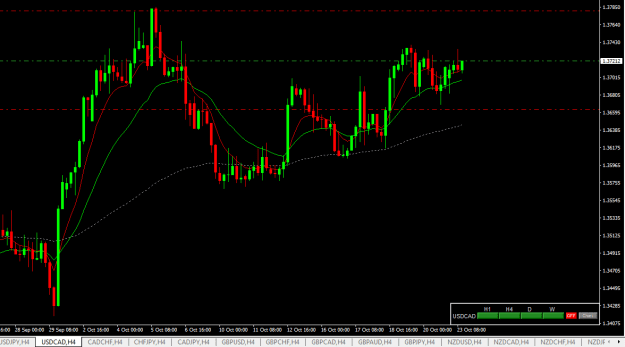
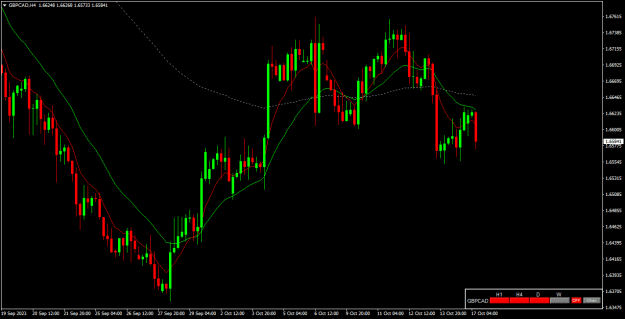
This trade gave me a hard time - pulled back and it took ages before it recovered. Have a look at the daily time frame. If I had been relying only on H4 I would have been more concerned and might even have closed this manually as it didn't look too ...
MA Crossover System that works for me
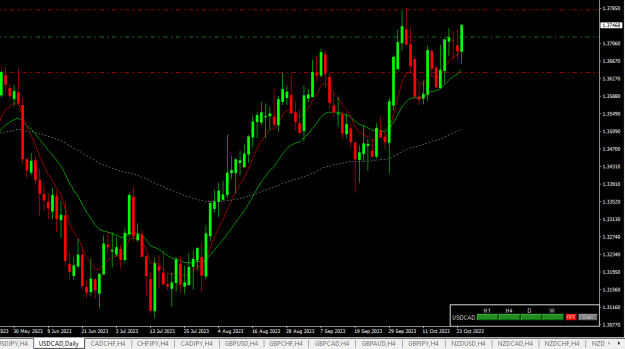
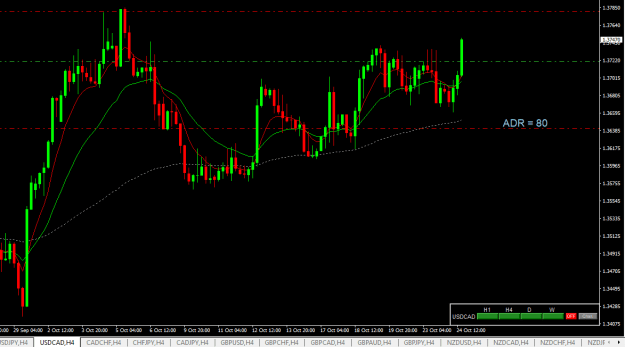
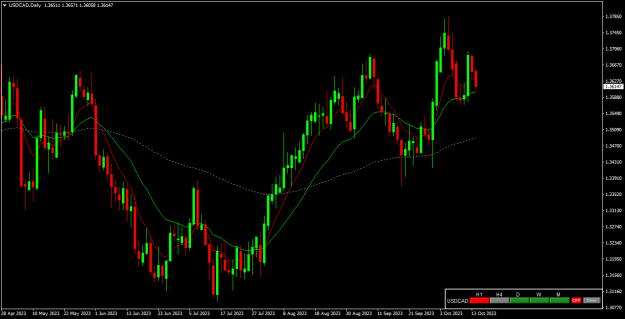
- AlistairC replied Oct 23, 2023
This USDCAD trade just triggered. image
MA Crossover System that works for me
- AlistairC replied Oct 20, 2023
To get a broader view I look at the weekly and monthly charts. The monthly shows me an overbought situation, so based on that I would be cautious of buying from here. The weekly, however, shows consolidation that could easily break out in the ...
MA Crossover System that works for me
- AlistairC replied Oct 19, 2023
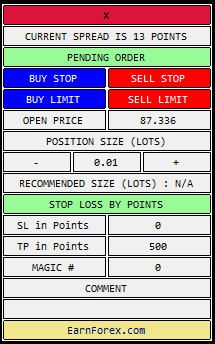
This is copied from an earlier post. I use it for almost every trade. Very useful to manage lot size. ========================================================================== I use an App to place trades because it calculates the correct lot size ...
MA Crossover System that works for me

- AlistairC replied Oct 18, 2023
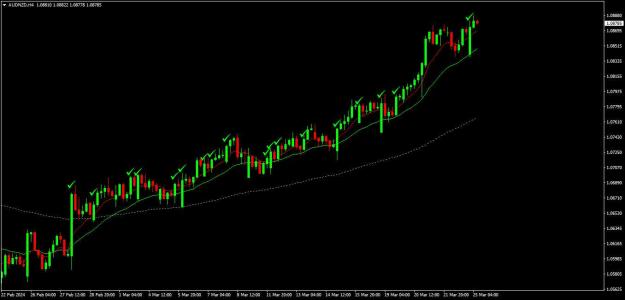
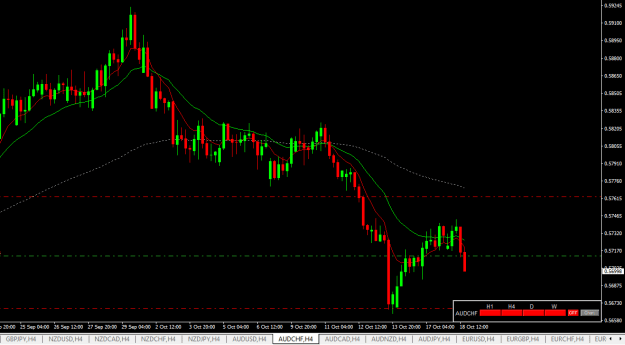
Similar to the previous one. This is AUDCHF, also moving nicely. 44 pip target, 50 pip SL based on ADR. image
MA Crossover System that works for me
- AlistairC replied Oct 18, 2023
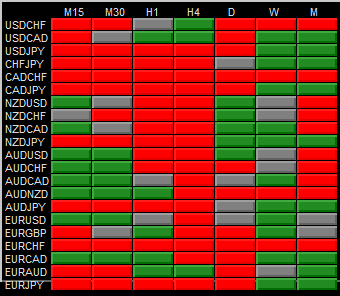
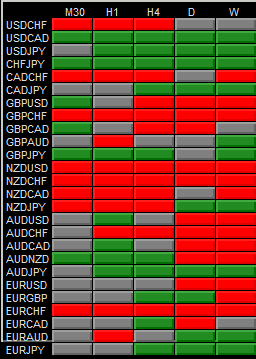
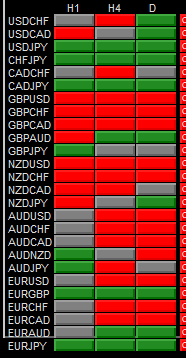
This is what the full OGT dashboard looks like across 5 TFs (8/21/100 EMAs). I have started using this at least once a day just to get an overview of what the charts look like and to see if there is anything I should go and have a look at. You will ...
MA Crossover System that works for me
- AlistairC replied Oct 18, 2023
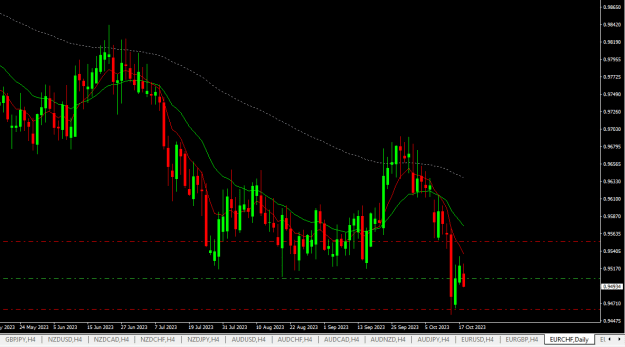
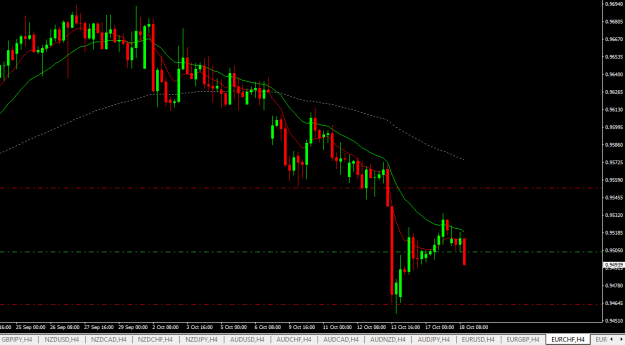
This EURCHF trade triggered earlier this morning. I got a signal from the EA and after checking I decided to take it (I find I reject more than I take). One reason I might have rejected this one is that it's close to a long-term low and is at the ...
MA Crossover System that works for me
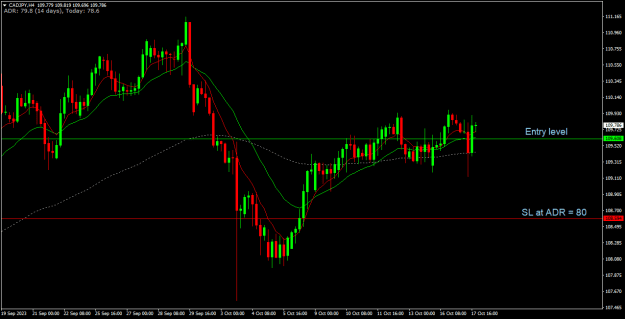
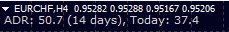
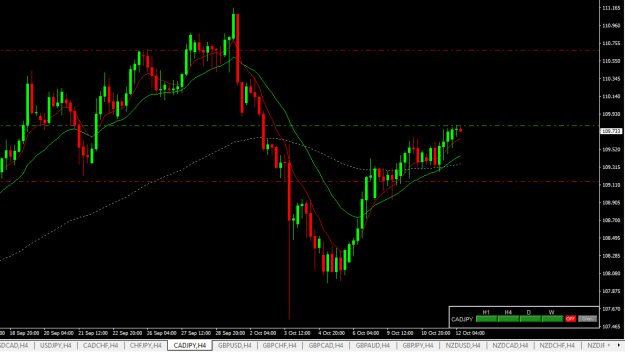
- AlistairC replied Oct 17, 2023
Assuming it should be the 14-day average value of ADR, this would certainly have saved my CADJPY trade today. image
MA Crossover System that works for me
- AlistairC replied Oct 17, 2023
I was thinking along similar lines. On another forum I was part of a long while back one of the respected members commented that after doing some backtesting research he found that price very seldom exceeded the recent swing point (where the SL ...
MA Crossover System that works for me
- AlistairC replied Oct 17, 2023
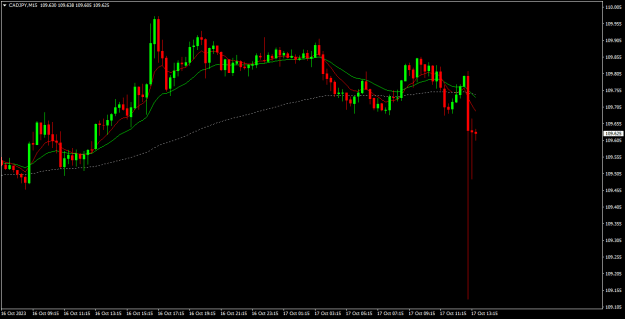
What just happened
MA Crossover System that works for me . Stopped out very suddenly on this CADJPY trade. Here it is on M15 to show how quickly it happened. And now it's almost back to where it was. Does anyone else have this spike on their charts? It's actually on all of ...
- AlistairC replied Oct 17, 2023
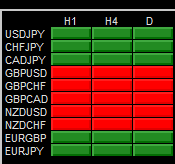
Here are some ways you can use the OGT trend dashboard One way is to set it to show all pairs that are actually trending (and you can ask for trending on 2, 3 or more TFs). This one is the 3x3 method - 3 EMAs trending on 3 TFs image Another is to ...
MA Crossover System that works for me
- AlistairC replied Oct 16, 2023
Hi kadak I'm not sure what system or method you are using, but all of the higher TFs show a bullish bias based on the 3 EMAs aligned approach (I use 8/21/100 EMAs). It's true that H1 has now turned down and H4 looks like it might follow suit, which ...
MA Crossover System that works for me
- AlistairC replied Oct 12, 2023
My trade for today. So far this month has been a bit messy for me, but I am 1.3% up, so I can't complain. image
MA Crossover System that works for me
- AlistairC replied Oct 12, 2023
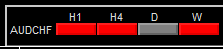
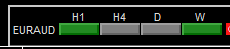
EURAUD and AUDCHF, would most likely move opposite to each other as AUD is a common factor. The OGT dashboard for each pair shows this, but neither has fully aligned yet. Once they have you still need to do a final assessment and safety check. I ...
MA Crossover System that works for me