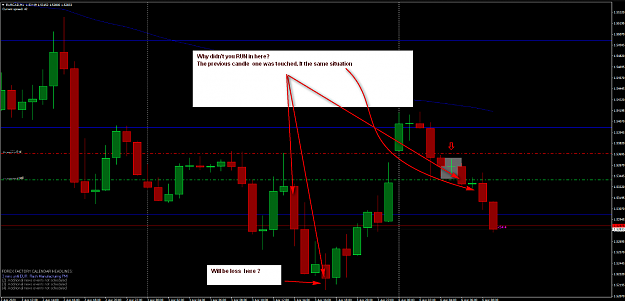
Look at this picture, please
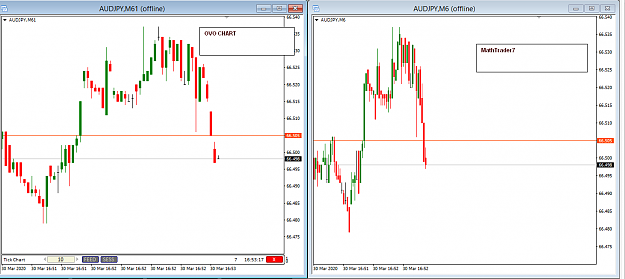
Thank you for your work. I am confused because it comparison chart 10ticks to 10 ticks from OVO tick, and the chart looks different. Can you advise something, why is this so? What should you focus on?