- Search Crypto Craft
- 81 Results (2 Threads , 79 Replies )
-
 !iii! replied Nov 25, 2021
Hi Davit, I've been following your thread since inception - hats off to your mix of stickiness to hard rules and learnt behaviour towards specific market conditions. This is meant seriously, as I have tried (semi-)manual approaches revolving around ...
Pivot Trading
- !iii! replied Mar 21, 2018
Following the idea of a fellow FF member for pivots to better work in ranging environment, I used the period congruent ranges (i.e. rolling daily H-L) as a filter for entries towards rolling daily pivots. The range detecting logic was to enter as ...
The Skill Check
- !iii! replied Mar 21, 2018
My code about the period congruent (i.e. only all first, second,..., 24th hour) sigma had a bug. I corrected that and, not unexpected, the sigma converges for a large number of samples. Nevertheless, it doesn't have any unknown impact on the Pivot ...
The Skill Check
- !iii! replied Mar 18, 2018
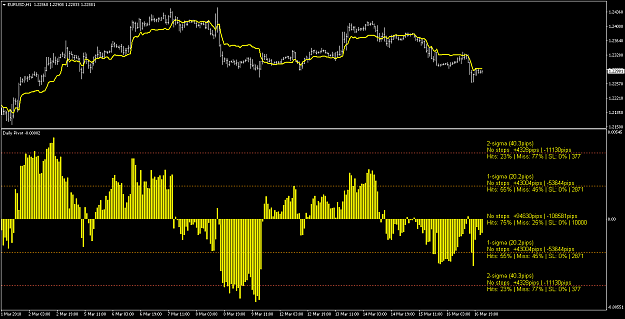
115 samples to validate the figures - they appear to be correct
The Skill Check
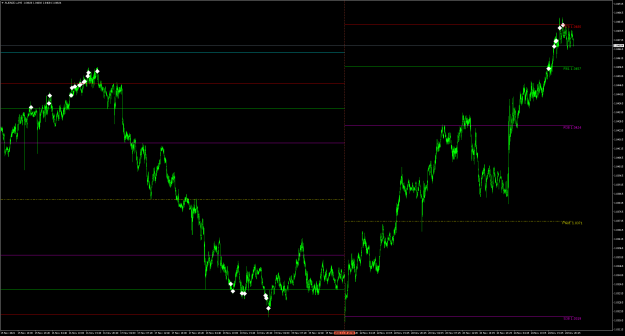
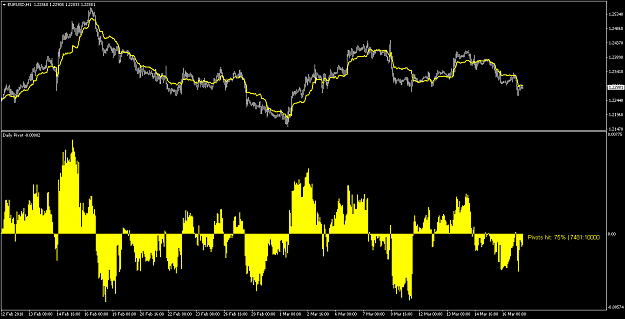
- !iii! replied Mar 18, 2018
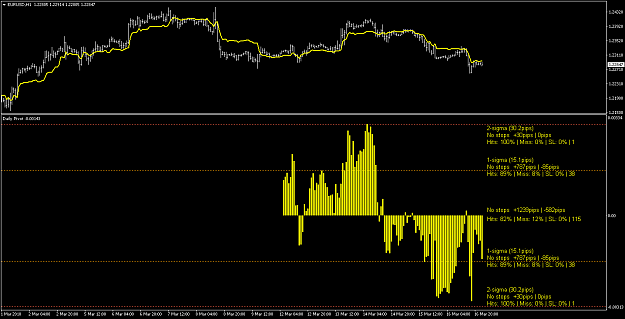
A close up for visualization of histogram and on chart rolling pivot
The Skill Check


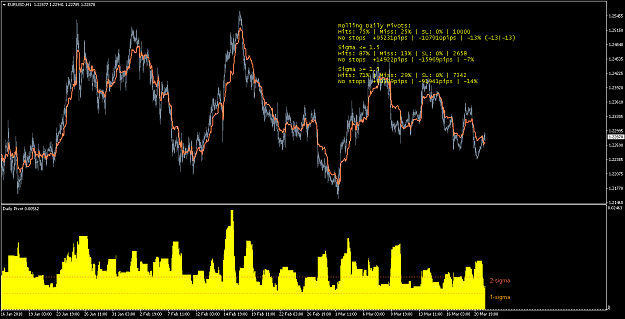
- !iii! replied Mar 18, 2018
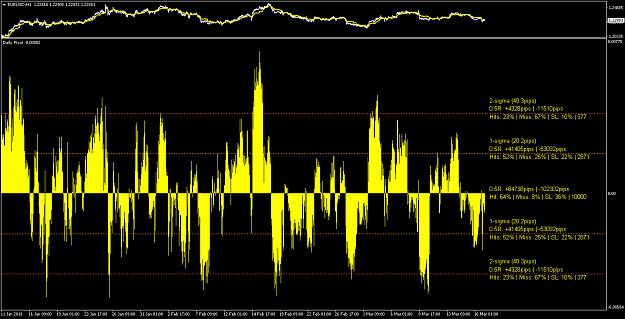
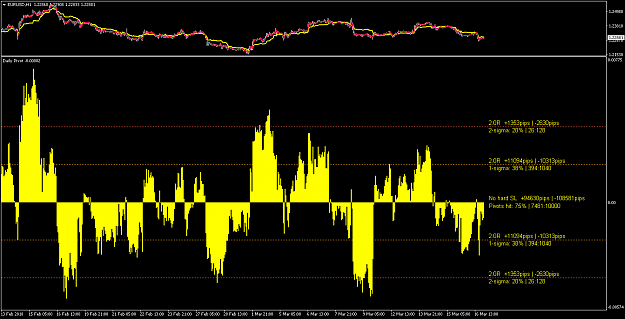
Sticking with the calculation of continuous pivot levels, I simulated opening trades a) from the open price towards Pivot, no hard SL (i.e. every bar), and b) from sigma 1 and 2 excursion levels, but with additional filters being Reward-to-risk at 2 ...
The Skill Check
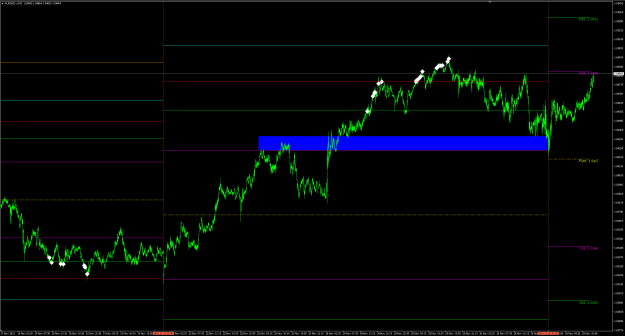
- !iii! replied Mar 17, 2018
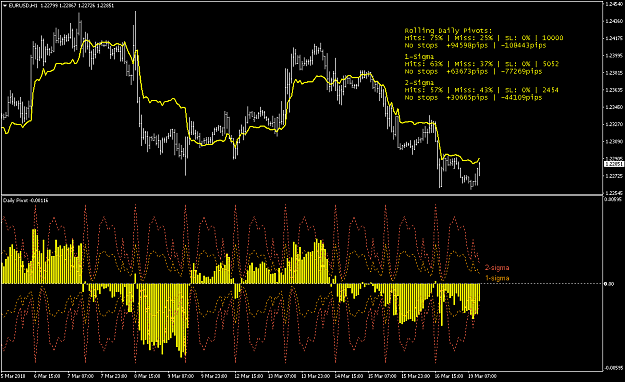
This is how the proximity of open prices to the continuous daily pivot looks, when using a H1 resolution - just like any other oscillator. As expected, the hit rate remains high, but so do the consecutive misses (I saw streaks of 24 misses on 1,000 ...
The Skill Check
- !iii! replied Mar 12, 2018
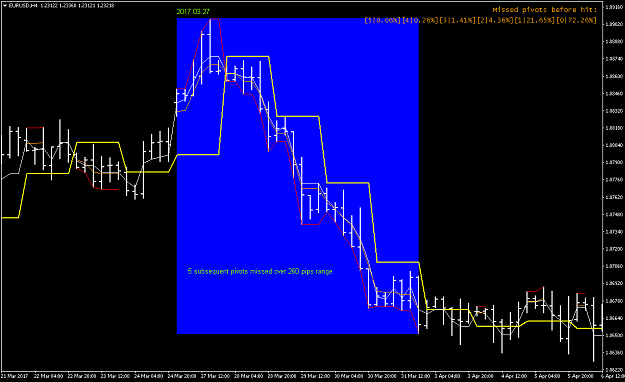
I finally got to correct the stats for # and % of missed daily pivots plus I also added the pip distances from open price of first bar to a) the pivot, if it was hit, and b) the open price of the first bar of the subsequent period, if it was missed. ...
The Skill Check
- !iii! replied Mar 4, 2018
I went back in history to find the above recorded 5 subsequent pivots misses: the trade direction changed after the first.
The Skill Check
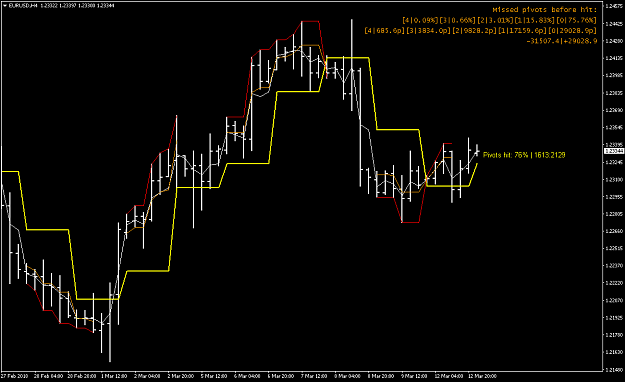
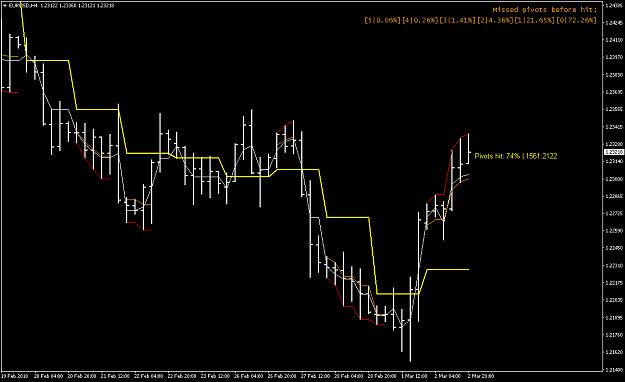
- !iii! replied Mar 4, 2018
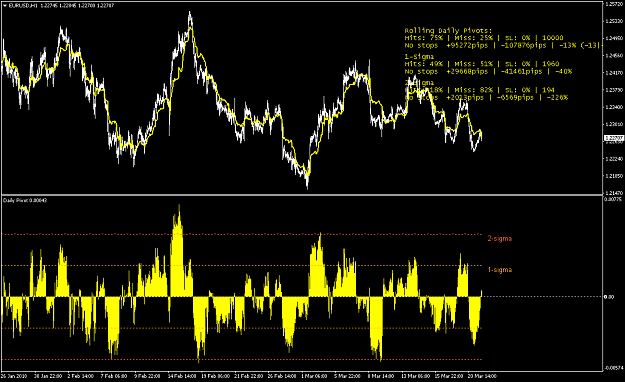
Sticking with the daily pivot calculation based on Phi (see post#46), I ran the indicator through 2122 days to again achieve 74% hit rate. I further added a frequency distribution of subsequent pivots missed before the actual hit, see upper right ...
The Skill Check
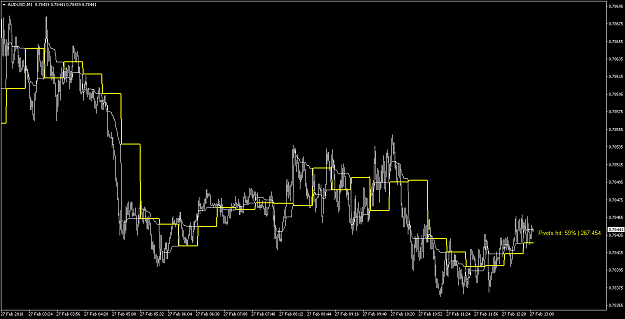
- !iii! replied Mar 2, 2018
Following your comment I created a duration weighted pivot which yields a very high hit rate... e.g. for H1 the pivot calculation is as follows: t(H)=M1 bars since High(1,H1) t(L)=M1 bars since Low(1,H1) t(Total)=t(H)+t(L)+1 P = High(1,H1) x ...
The Skill Check
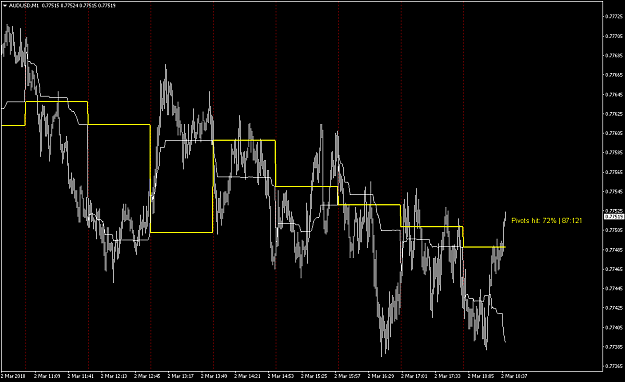
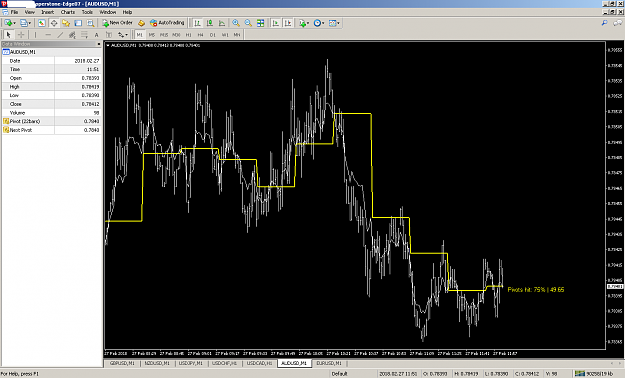
- !iii! replied Feb 27, 2018
Sorry to clog your thread, Sis, but pivots are statistically interesting: no matter what sample sets I choose (e.g. here I chose 22 bars or 22 min on a M1 chart), the pivot hit rate remains at approx. 75%. It reminds me of the scaling laws ...
The Skill Check
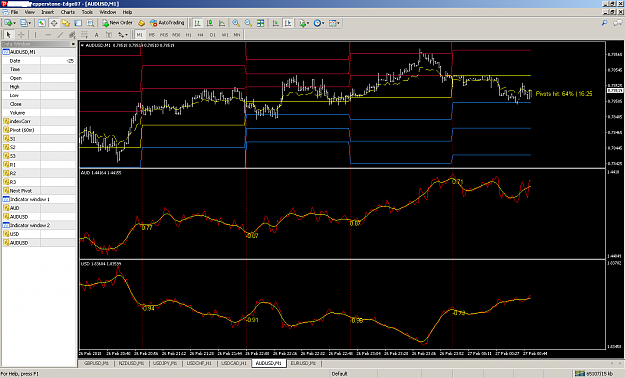
- !iii! replied Feb 26, 2018
Tried to establish Pearson r between the pair and its components for every pivot period...hmm.
The Skill Check
- !iii! replied Jan 23, 2018
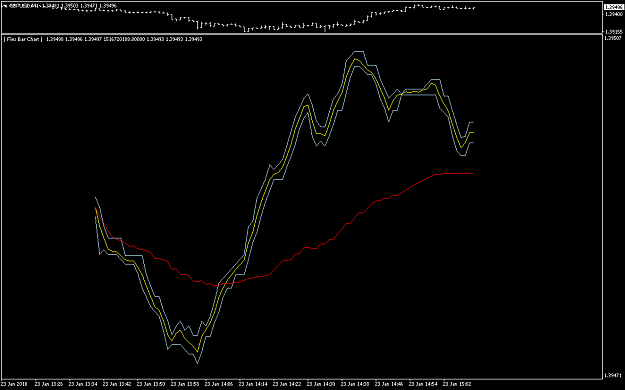
I am still at the raw data prep... Latest test: a range+time bar chart combo - i.e. a bar shifts (=new sample) either when 1 sec has passed or a range has formed. The yellow line is the average of all the ticks within a bar.
Higher Edge within a Single Candlestick