- Search Crypto Craft
- 15 Results
- pipperboy replied Apr 25, 2016
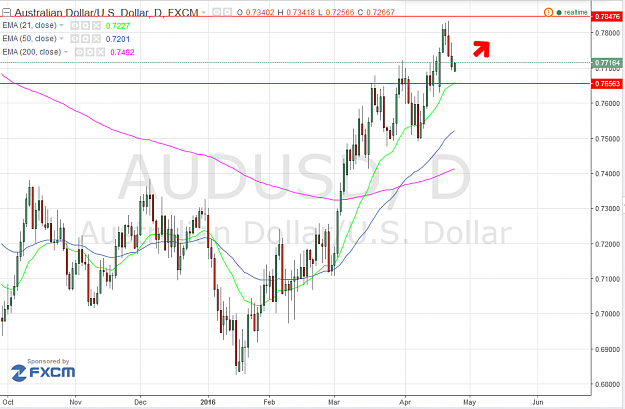
AUDUSD (April 25-29) [look back for updates!) April 25 image Applying the EMA 21 theory, price should continue to push upwards to the next resistance level, 0.78476.(18 june 2015 resistance) Stop loss 0.76563 (EMA 21) Enjoy!
8-5 job, no bullshit daily technical system
- pipperboy replied Apr 25, 2016
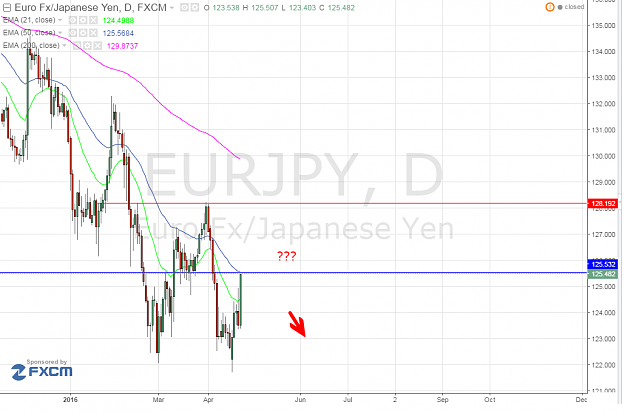
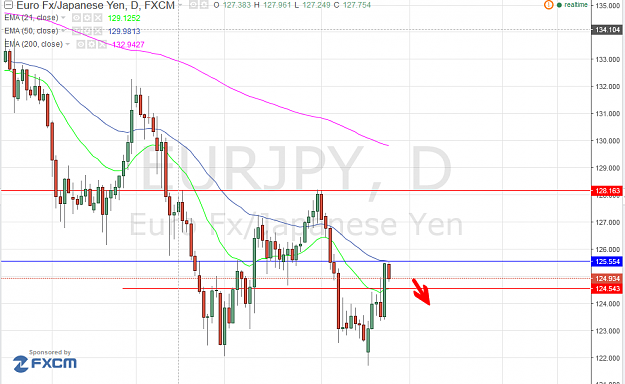
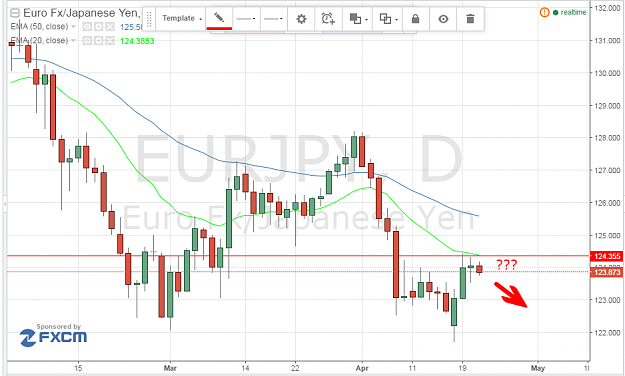
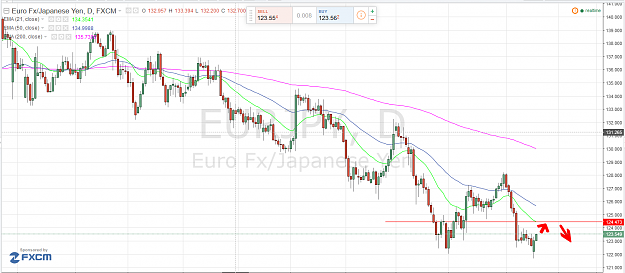
EURJPY (April 25-29) [look back for updates!] April 24 (before market opens) image Same thing, price went through EMA 21, and went almost to EMA 50. Still, trend remain bearish in my opinion, and price should retrace to pre-BOJ price. April 25 ...
8-5 job, no bullshit daily technical system
- pipperboy replied Apr 25, 2016
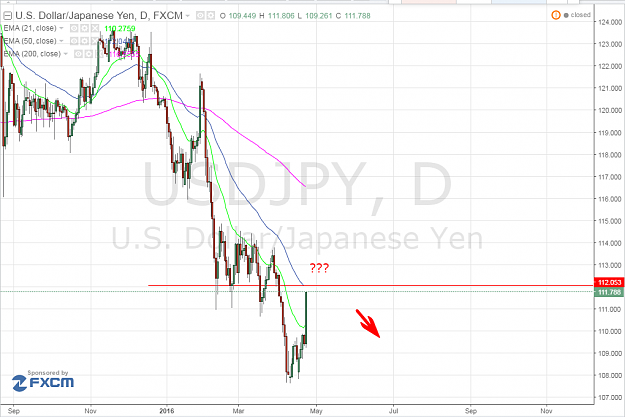
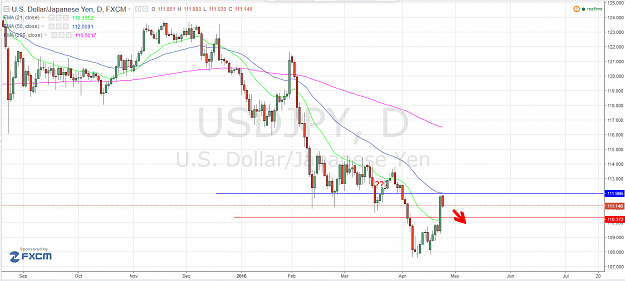
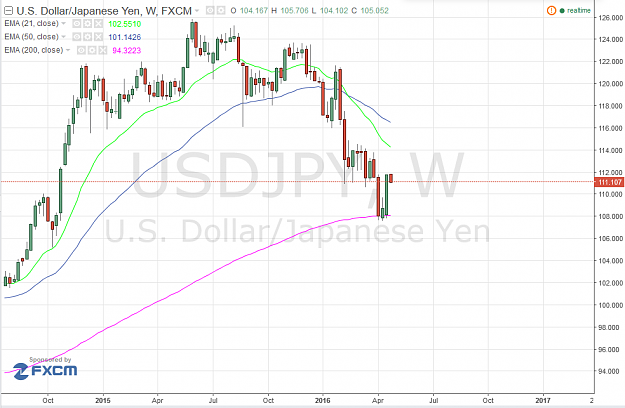
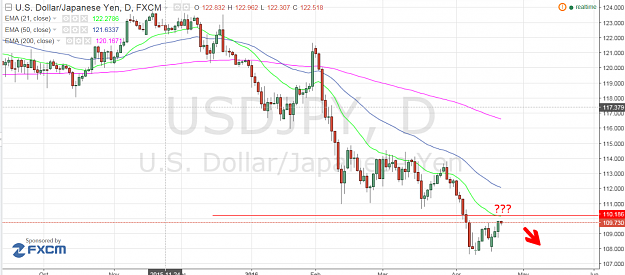
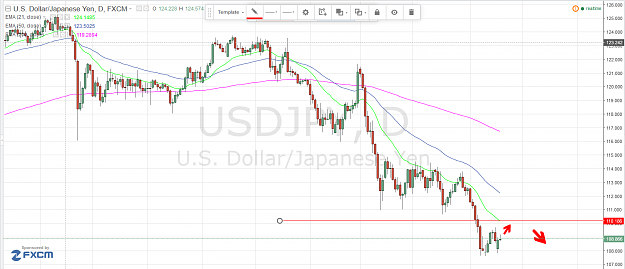
Hi guys! I did the charts over the weekend but was too busy to pen it down in words properly. Now back to the weekly updates. USDJPY (April 25-29) [look back for updates!] April 24 (before market opens) image Although BOJ moment caused a spike ...
8-5 job, no bullshit daily technical system
- pipperboy replied Apr 22, 2016
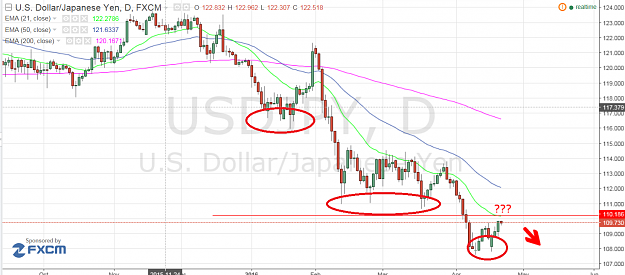
Woah. Before you get personal, how do you explain the two triple-bottoms before that? Did price went bullish for long? There's nothing certain in markets. It's true triple, double bottoms signal a reversal is coming, but you can't ignore the bigger ...
8-5 job, no bullshit daily technical system
- pipperboy replied Apr 21, 2016
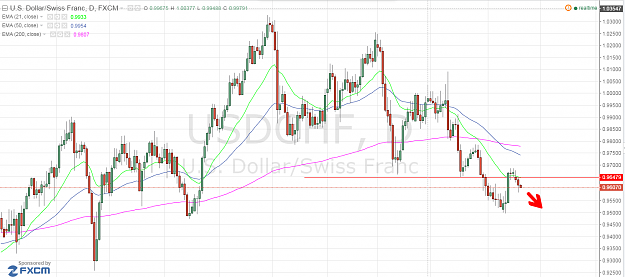
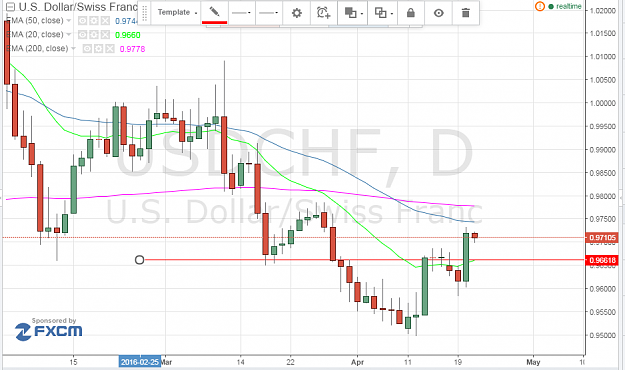
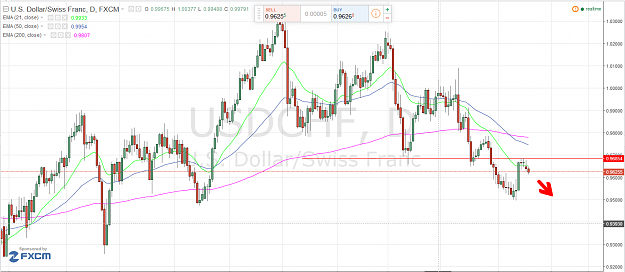
USDCHF Basics: EMA 21 LIVE TRADE EXAMPLE April 19 image Price just hit a double top near EMA 21 and it seems that price has rejected at EMA 21 for downtrend to resume. I shorted at 0.96489, stop loss 0.96854. April 20 image Price continued its ...
8-5 job, no bullshit daily technical system

- pipperboy replied Apr 21, 2016
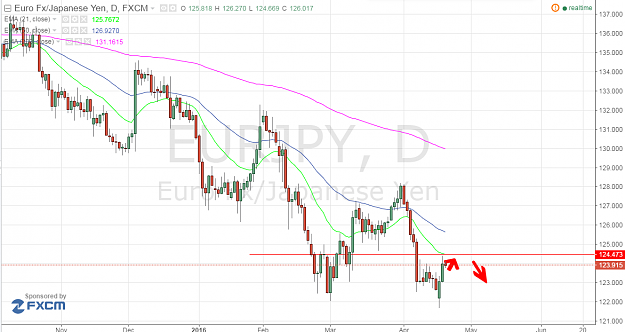
EURJPY Basics: Trading Moving Average LIVE TRADE EXAMPLE April 19 Price was 123.459. EMA 21, 124.473. Price is on retracement to test EMA 21. Stoploss at 122.299 (close of previous day candle) image April 20 Price tested 124.396 before retracing. ...
8-5 job, no bullshit daily technical system

- pipperboy replied Apr 21, 2016
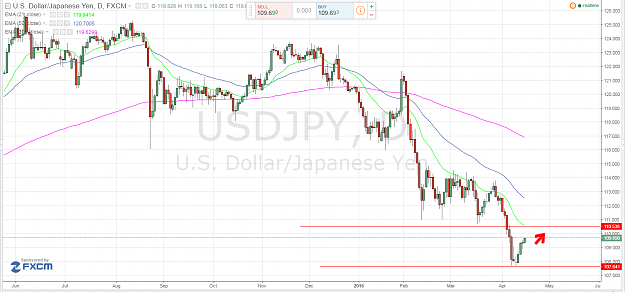
USDJPY Basics 1: Trading Moving Average I'm sure most of you have read it online on how to use moving average. Moving average is more than just a signal to long or short, based on how it's above MA 50 or below MA 50. Moving average can be used as a ...
8-5 job, no bullshit daily technical system


- pipperboy replied Apr 20, 2016
Sharing my thoughts(would appreciate constructive feedbacks): When i posted, price was 108.86. It went up as observed to 109.893 before returning to 109.730 at time of post. For those who followed, a good 100pips before retracing back to 80+pips at ...
USD/JPY Discussion
- pipperboy replied Apr 19, 2016
My thoughts process: Yesterday when i posted, price was 123.549. Long. I mentioned 124.473 is the price to look out for. (yesterday EMA 21). Price then tested 124.396, before retracing. Today's price may or may not break EMA. If there's a false ...
EUR/JPY

- pipperboy replied Apr 19, 2016
Sharing my thoughts process: -Price respected EMA 21 since 11 March. -Downtrend ever since -Stop loss set at 0.96479 (current EMA 21)
USD/CHF

- pipperboy replied Apr 19, 2016
Price just retested resistance at 0.96854 as well as EMA 21. Price to resume downtrend
USD/CHF
- pipperboy replied Apr 19, 2016
EMA 21, 124.473, is the level to watch out for. Long until that point, or short once price tested this level to continue downtrend.
EUR/JPY
- pipperboy replied Apr 19, 2016
EMA 21, 110.186, is the level to watch. Long now to that EMA, or when price retraces to that point, short to continue downtrend.
USD/JPY Discussion
- pipperboy replied Apr 14, 2016
Jpy weakens. Next resistance is the 21 EMA. See where it goes after that.
USD/JPY Discussion
- pipperboy replied Apr 14, 2016
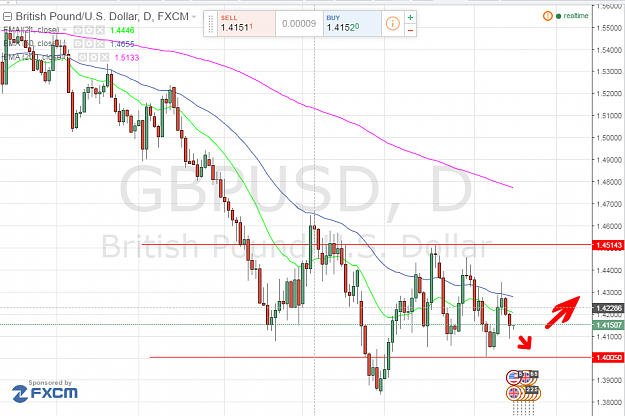
GBPUSD The cable is undergoing a range market. This is the general forecast for those who wish to trade range market.
Cable Update (GBPUSD)
- Posts by Member Search: 'pipperboy'