- Search Crypto Craft
- 49 Results
- paradoxical replied Nov 5, 2014
First thread and it got moved for some reason. Oh well. Here is a screen shot for those interested.
Five and twenty for the money
- paradoxical replied Jan 9, 2011
Am posting another picture as the first one covered the indicator and this one is better. To change the location of where the indicator appears on your chart, go to "inputs", and scroll down to "adjust side to side", and enter 520. That will ...
Forex Bible System
- paradoxical replied Jan 9, 2011
Sure. Here it is. I know the problem of people posting charts with different indicators, so I'm not trying to convert anyone here. Everyone has their own preferences, and your system is easy and has worked for me well for the past week. That big ...
Forex Bible System
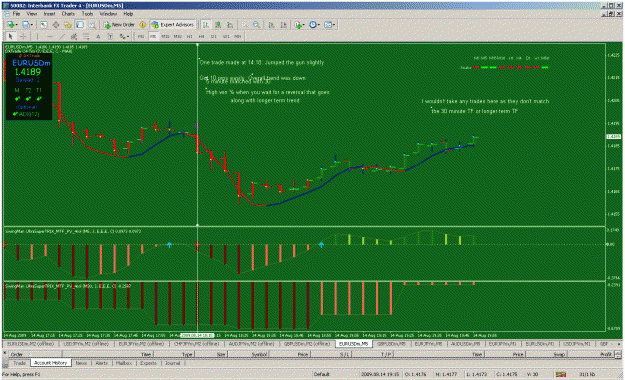
- paradoxical replied Jul 1, 2010
Thanks, PipFX, right now, I am experimenting with using a white line chart, and ALF line and some other things. I have had to completely wipe my platform clean and reload. When I did and reloaded the ALF indicator and ALF Alert, those particular ...
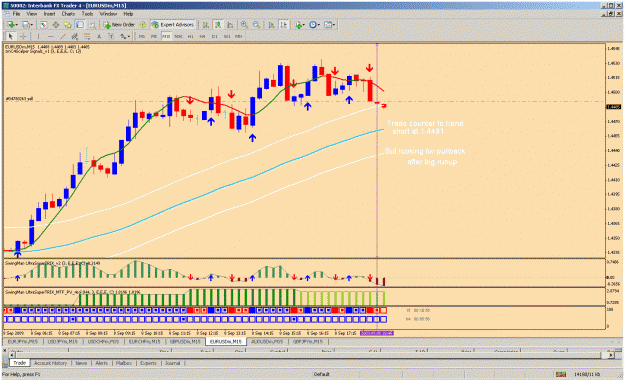
No Name Trading System
- paradoxical replied Jun 10, 2010
Here is what I think is a good example of trading with the current trend, which I can easily on the time frames from 5 minutes to daily, which are ALL red. When the price action went back down over the the ALF line just awhile ago, I took a short. ...
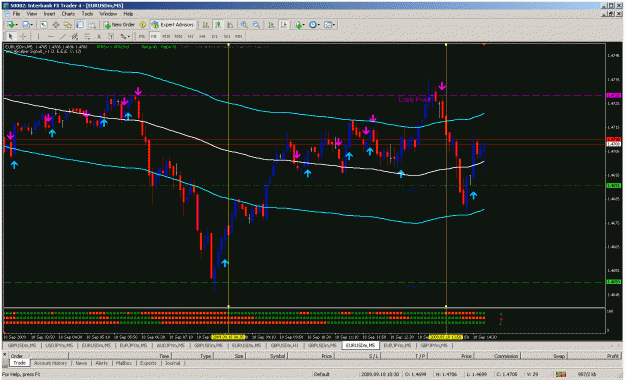
ALF revisited - simple, effective daytrading
- paradoxical replied Sep 18, 2009
I like to look for trades where the pair is extended, betting on a pullback towards "center". These trades are NOT in conformance with this system as the three times are NOT lined up. Just an observation for consideration.On the EU, the lines are 20 ...
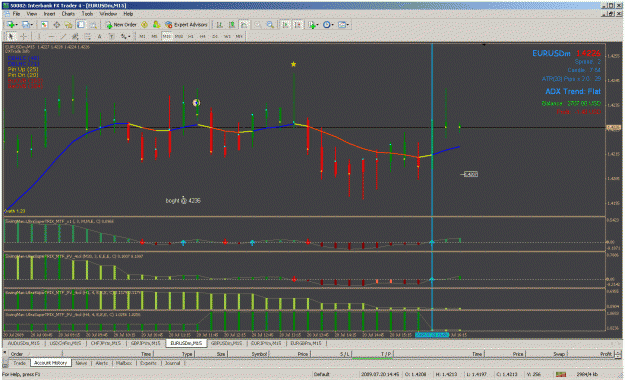
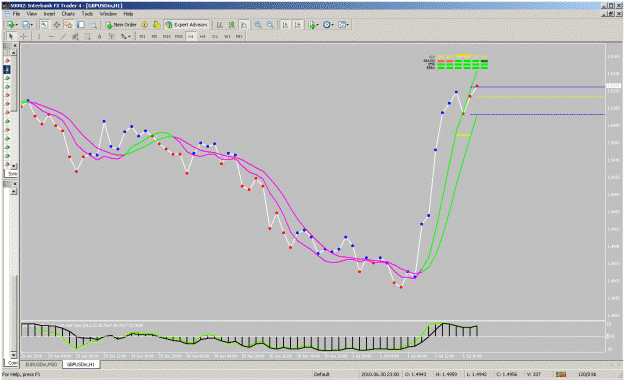
MTF Trix system
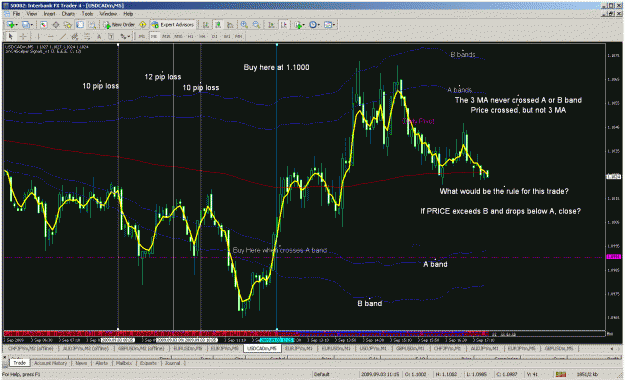
- paradoxical replied Sep 8, 2009
Recent trade. Didn't make trades earlier as I thought there was too much of a runup. This is a counter trend trade as EU is about 25 pips away from a 79 Moving Average. Will see what happens. TP and SL of 25
MTF Trix system
- paradoxical replied Sep 7, 2009
I'm looking at when the 15 minute and 240 minute match & will keep testing. The turquoise line is a 79 Moving Average, and the two white lines on either side of it are set 25 pips from the line. I like this visual to let me know how far the pair is ...
MTF Trix system
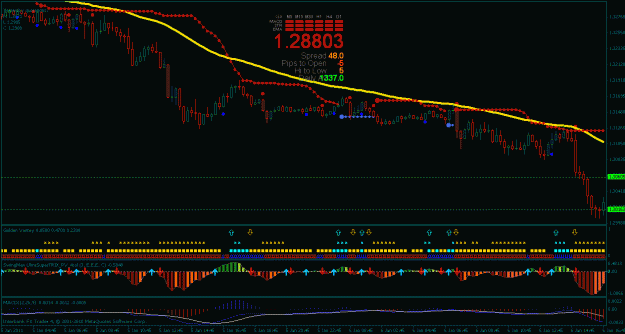
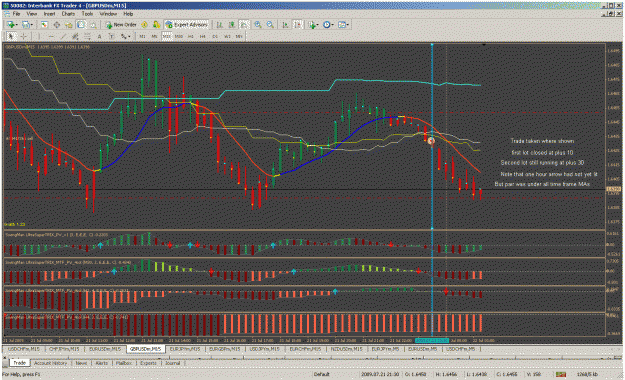
- paradoxical replied Sep 3, 2009
Chart of the UCAD. No particular reason for choosing it. As i understand the rules, there would have been 3 trades that would have been losers in the area of 10 pips or so before spread. The last trade would still be open according to the rules, as ...
System for Trending and Ranging Markets
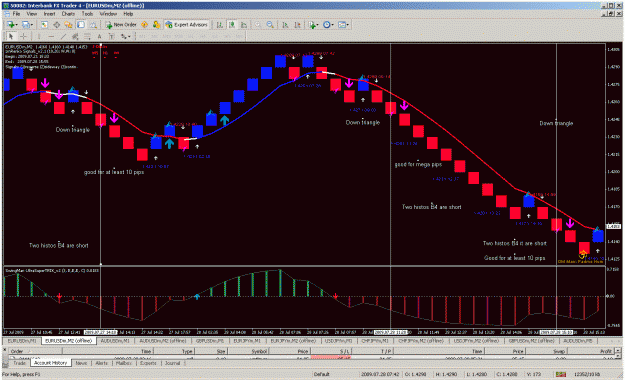
- paradoxical replied Aug 14, 2009
Here's a chart on one of the trades with notes. Trading the 5 minute off the 30 minute has been working well when I stay with the current overall trend. Usually when the 30 minute and 5 coincide, the rest do also, but not all the time. Only going ...
MTF Trix system
- paradoxical replied Jul 30, 2009
Yet more proof that a bunch of people working together can produce some great things. After your post, I dusted off the ole 8,3,3 stoch that I used some time back. I have eliminated all the other indicators so people can see just how accurate and ...
C4 Scalping
- paradoxical replied Jul 29, 2009
From Lanoster "P.S. When I get time I will check out Constant Range Bars- since they leave evidence of the whole of price movements. But at the moment I am still investigating various indicators on the Renko bars. I am not convinced by paradoxical's ...
C4 Scalping
- paradoxical replied Jul 29, 2009
Swingman's previous post and observation about the EUR/USD continues to amaze. Again today there were yet three more trades that would pick up 10 pips and more. Am not sure the "whys" for this, but most likeley due to continued momentum of price. ...
C4 Scalping
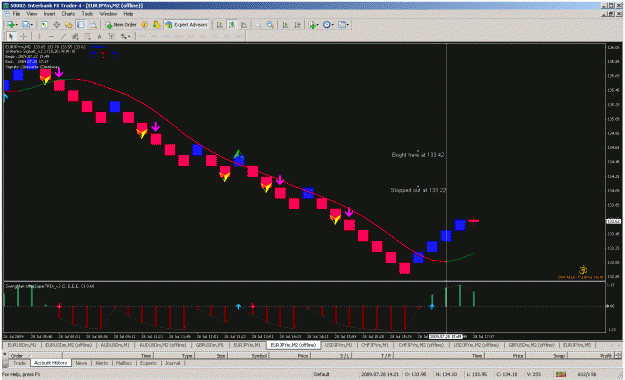
- paradoxical replied Jul 28, 2009
OK, Edge. Heres two of them. Both trades non conforming as there was no arrow signal. On one of them, saw the traiangle and it go past the line. Almost soon as I entered, it went the other way. I guess the second chart shows how just doing a visual ...
C4 Scalping
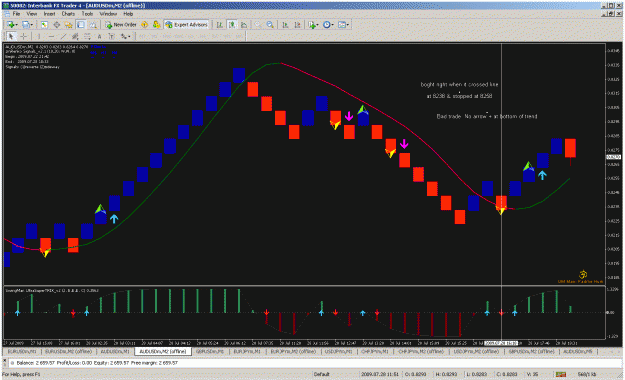
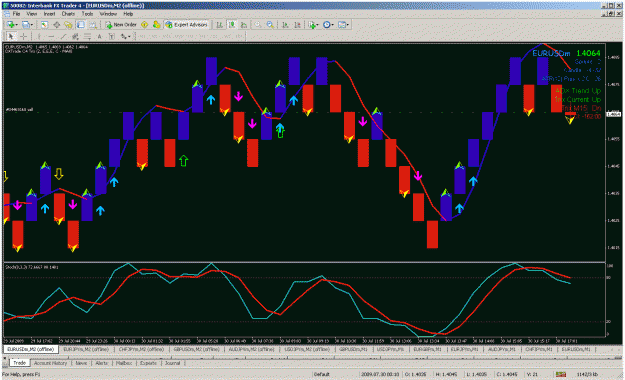
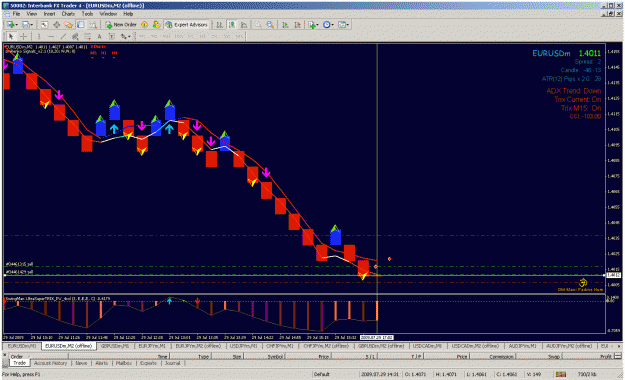
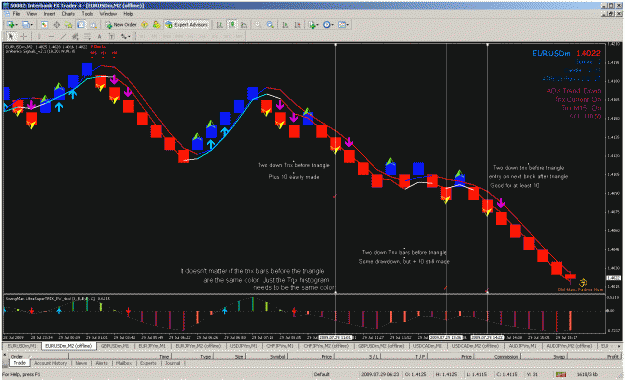
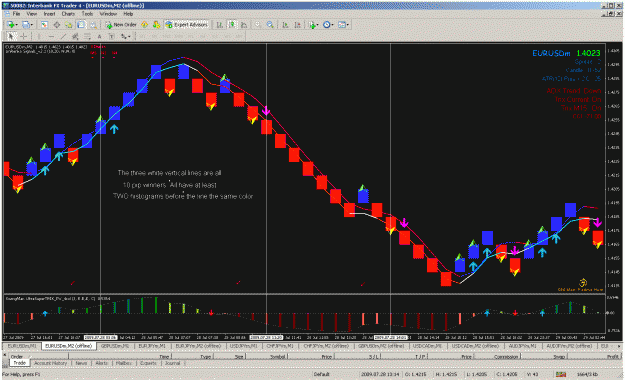
- paradoxical replied Jul 28, 2009
Irathi, the attached is my understanding of what Swingman was saying. Whenever the triangle appears, and there at least two TRIX histograms before the triangle in the same direction, it's a near certain 10 pip winner. This applies of course to long ...
C4 Scalping
- paradoxical replied Jul 27, 2009
Here's an odd thing. On GBP/USD, my renko chart is haywire. I set the blocks at 14 & you can see the first half are all even. After that, they are various sizes. Only happening on GBP/USD. The other pairs I have it on work fine. Also doesn't matter ...
C4 Scalping
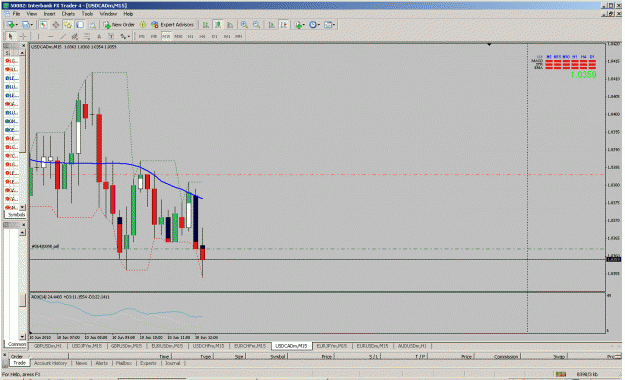
- paradoxical replied Jul 25, 2009
I just got "renko", and am a newbie with them, but trying to be a fast learner. On this chart, the bars are set at 13 pip increments, which I figure would get me 5 pips after spread both ways. This is a weekend, and time to fool around with ...
C4 Scalping
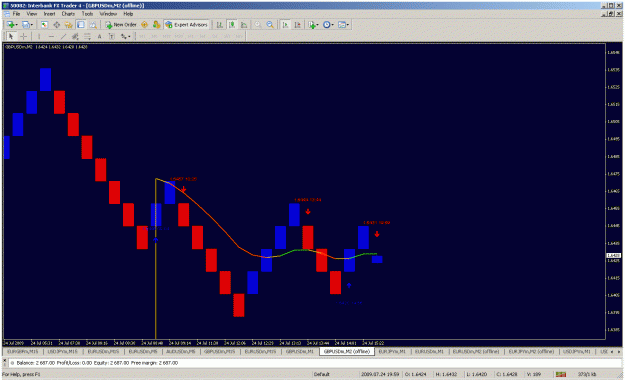
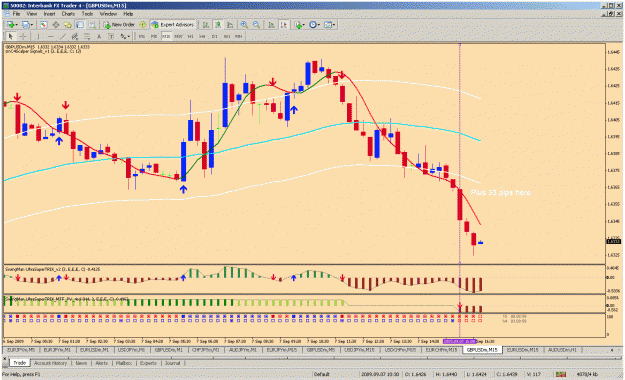
- paradoxical replied Jul 21, 2009
Attaching a picture of one trade on GBP/USD to show what Indrek was referring to on trading when the pair is below the MTF moving average. In the case of this trade, I got in earlier than I would have otherwise. Have been other positive trades this ...
MTF Trix system
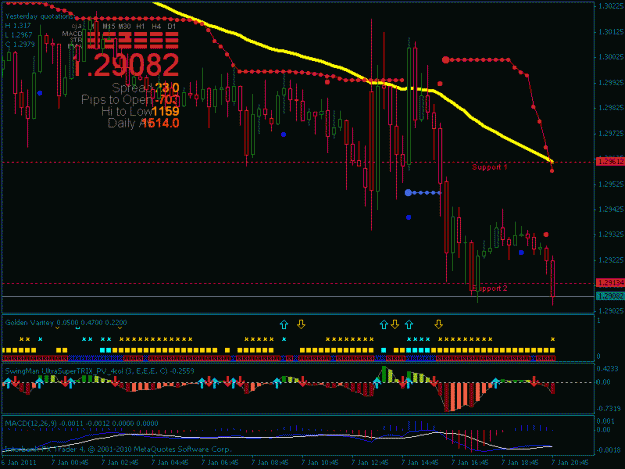
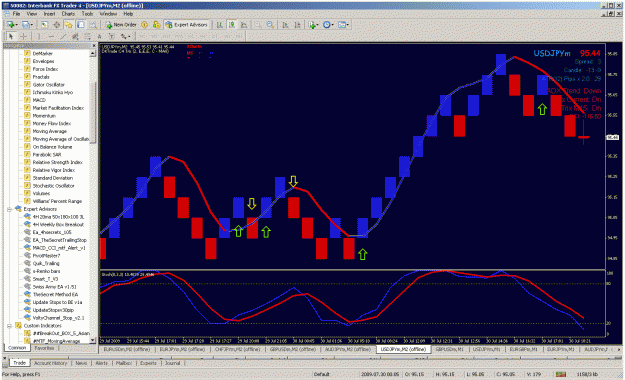
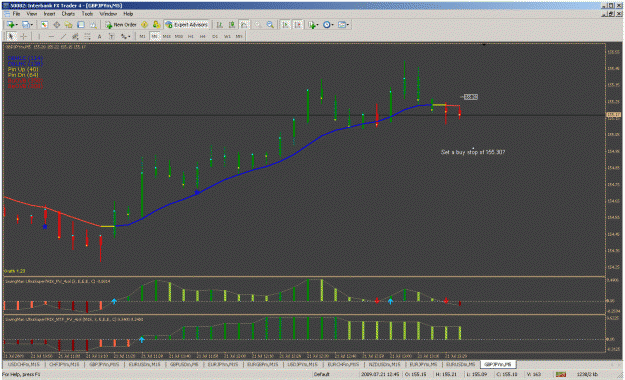
- paradoxical replied Jul 21, 2009
Edge, Here's a shot of what I mean, using the GBP/JPY as an example. It's in an uptrend, and has pulled back. To be above the TRIX line, it would need to hit 155.28. Similar situations occurred with the EU and EY earlier. Would these be situations ...
C4 Scalping
- paradoxical replied Jul 20, 2009
One thing on the Trix arrow placement, you'll see the arrow showing at the 16:00 bar on this chart. My trade did go off at the high of that bar, and I made 10 pips on the next bar. For those new to this, the trix arrow can appear anywhere during the ...
MTF Trix system