- Search Crypto Craft
- 137 Results
-
 ocd replied Feb 4, 2024
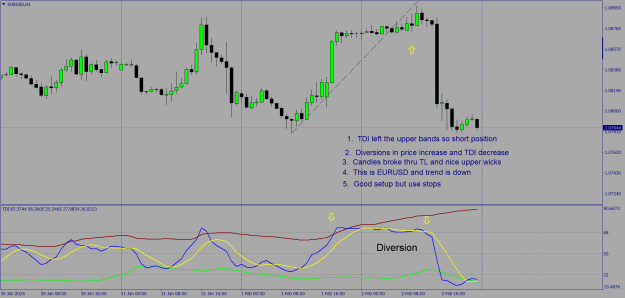
Here is a simplified way to use Trading Made Simple. I apologize to the purists out there but this way requires very little time to analyze what you see and requires few brain cells... Here is my conclusion about eelfranz's system...I use regular ...
Trading Made Simple
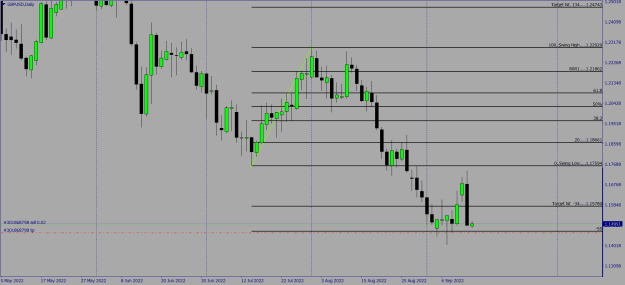
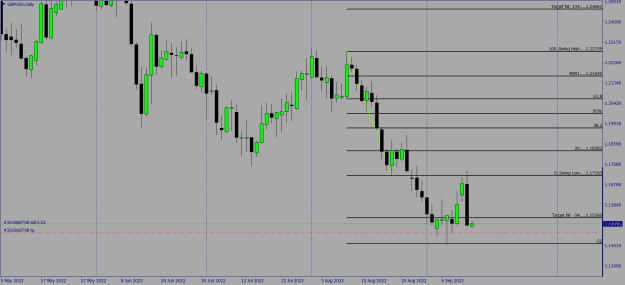
- ocd replied Sep 13, 2022
Let's see if I remember how to do this. Probably gonna be all screwed up but THAT is for your pleasure
Trading Made Simple
- ocd replied Feb 11, 2019
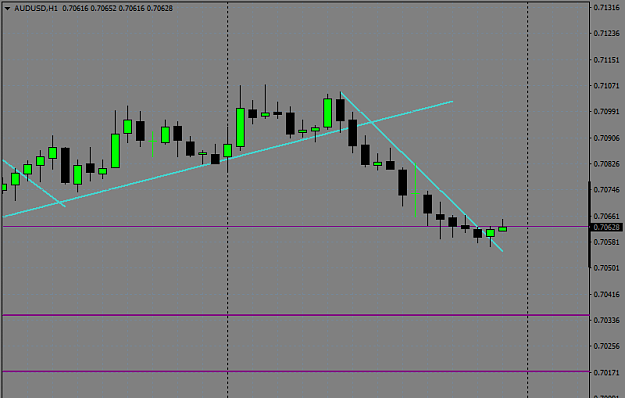
image image We were doing so good for a very poor time of the day to trade. And then, wham! New day and a gap up...but whatever. It broke the trend line and I was in on the first candle breach and out on the first candle breach. Money ...
Trendline Break (The Only System You Need)
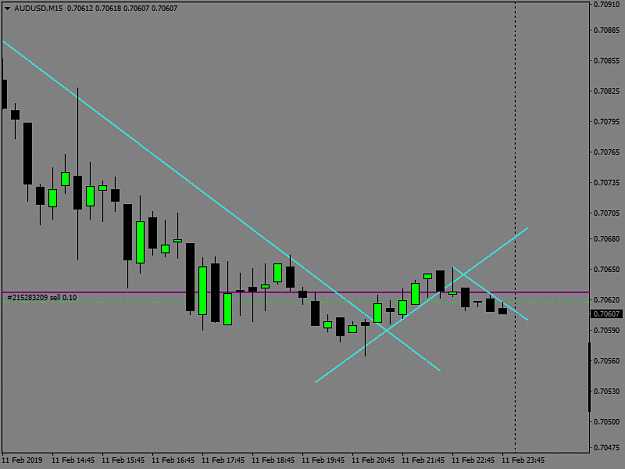
- ocd replied Feb 11, 2019
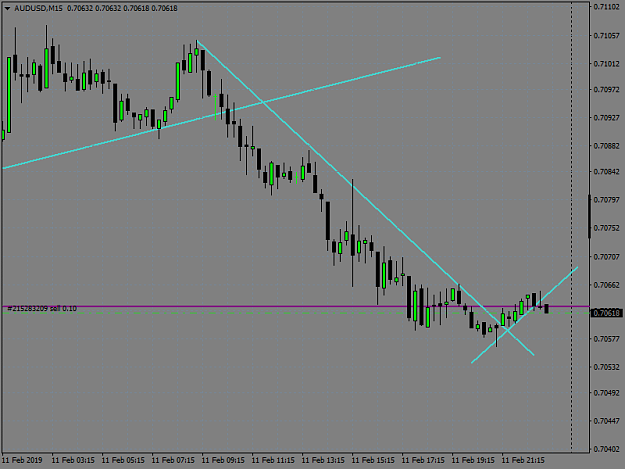
image Here's a trade I just entered. Let's see where this goes
Trendline Break (The Only System You Need)
- ocd replied Feb 11, 2019
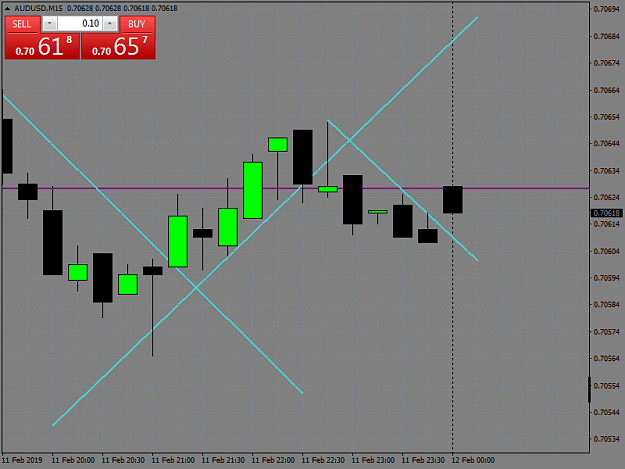
image Just look at this chart. It tells you when to get in and when to get out. You can do this on any timeframe but just remember that a 5 min chart will have less pips than a 4 hr chart per move. This ain't sexy but it is very effective. Edit: ...
Trendline Break (The Only System You Need)
- ocd replied Jun 22, 2016
Well my last post was for someone who is learning and wants a simple/extremely effective way to trade reversals and trends. Using a trendline on a higher timeframe is very accurate for the trader wanting to accumulate pips. Using trendlines on lower ...
How to identify trend reversals in Forex
- ocd replied Jun 21, 2016
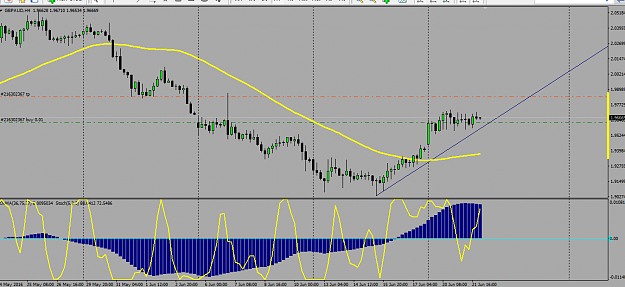
I like the simple approach anymore, but, I didn't use to. Drawing lines is easy and offers a good visual. This is the GBPUSD on 1 hr...once the trend line is broken thru you can see where price (candles) consolidates before it goes up. image
How to identify trend reversals in Forex
- ocd replied Oct 16, 2015
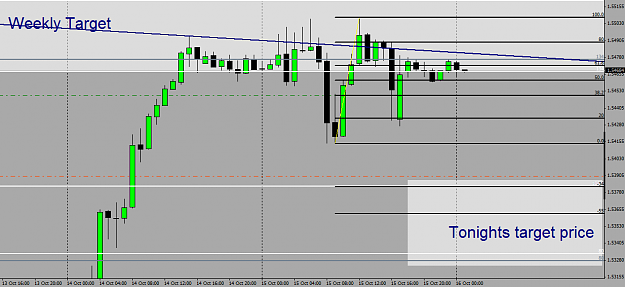
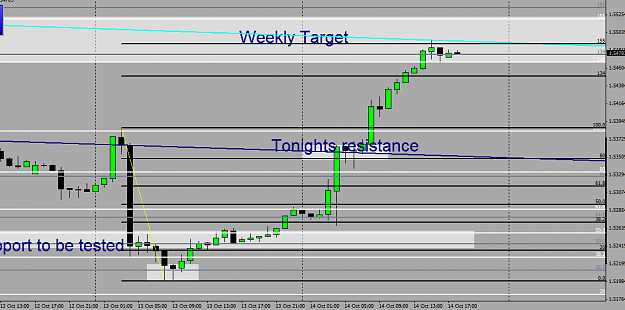
Here's my trade for tonight. I'm thinking bears control the night unless the bulls really get aggressive. So I'm selling resistance. My entry for the short is at tonight's 38.2% level (1.54497) and my take profit level is just above the Weekly 100% ...
Fibonacci and 50 bucks
- ocd replied Oct 16, 2015
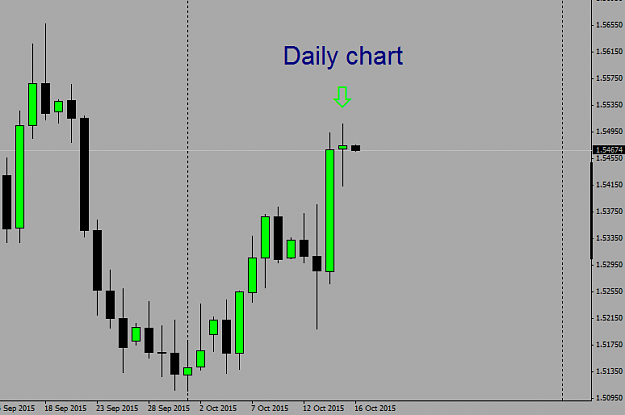
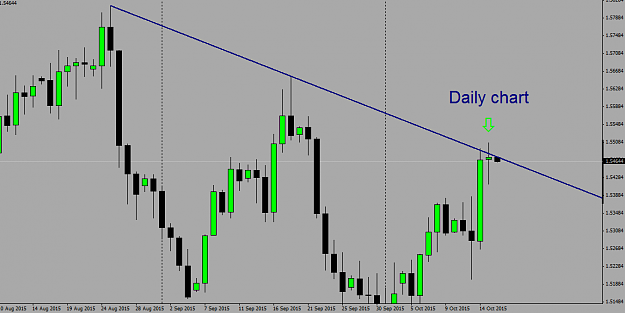
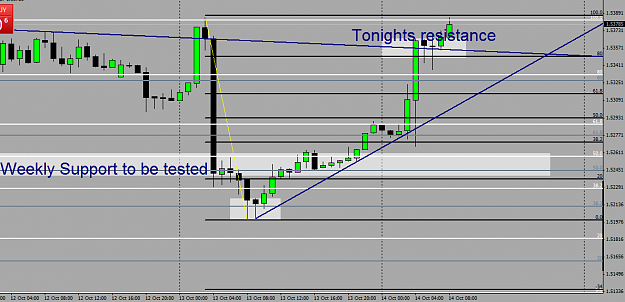
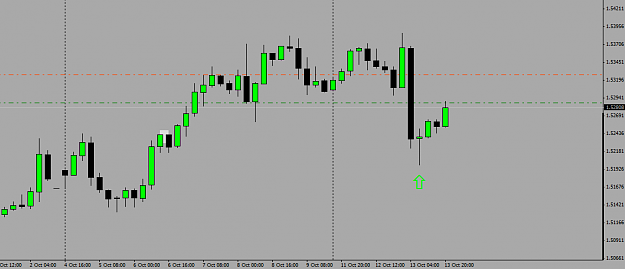
Okay so I zoomed out on this chart to the Daily timeframe to get the big picture. Notice the green arrow...indecision...carnage by the bears acoming son. Second chart I just added the diagonal trendline to show what price is up against.
Fibonacci and 50 bucks
- ocd replied Oct 15, 2015
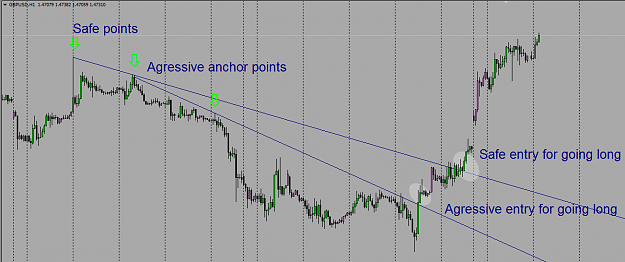
I won't be trading tonight because I can't figure out which direction price moves tonight. Price is sitting just below a big resistance diagonal trend line. So that screams overbought. However, the next diagonal trend line above current resistance ...
Fibonacci and 50 bucks
- ocd replied Oct 14, 2015
And it did! BTW, I just got home and am all excited.
Fibonacci and 50 bucks
- ocd replied Oct 14, 2015
I'm kind of bummed out because this Trade Explorer isn't right and I won't have time to get it fixed for the next week or so. So, we'll do the old fashioned "paper trading" method for now. LAST NIGHT's action...I entered a long position at 1.52877 ...
Fibonacci and 50 bucks
- ocd replied Oct 13, 2015
Speaking of price action...let's check out the candles on a 4 hr chart of GBPUSD. Bullish enough for you?
Fibonacci and 50 bucks
- ocd replied Oct 13, 2015
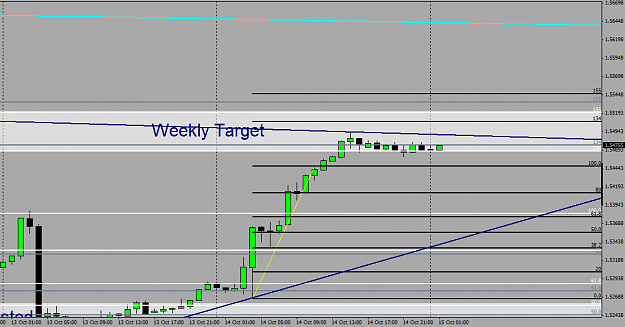
So here's the deal. I don't know why but my Trade Explorer is not synched to this thread. The account numbers don't match...wth? Anyway, I set a buy stop at 1.52877 with an exit set at 1.53275. My reasoning? The weekly 50% level was tested and held ...
Fibonacci and 50 bucks
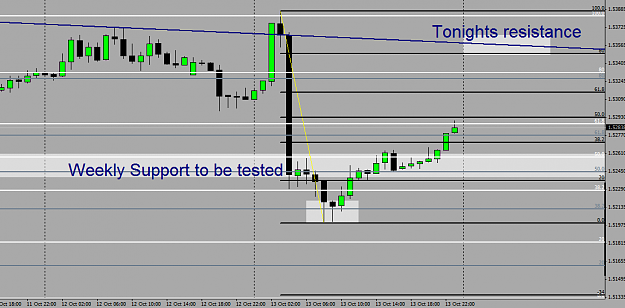
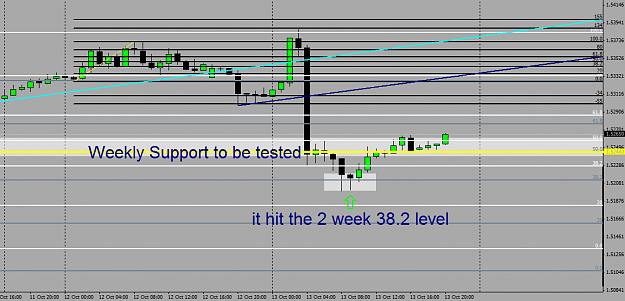
- ocd replied Oct 13, 2015
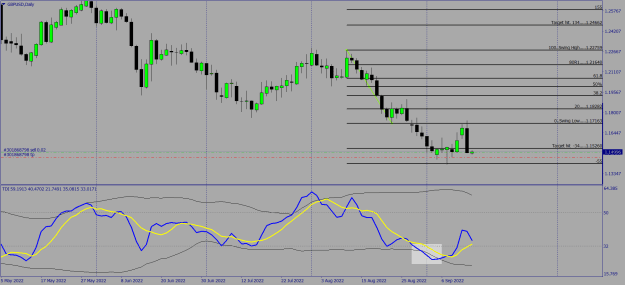
Okay...so I passed out before the party last night and woke up to see what I thought would take place did in fact take place. Weekly support was tested but it took it further and hit the 2 week fib level of 38.2%. Notice the 2 candles for the ...
Fibonacci and 50 bucks
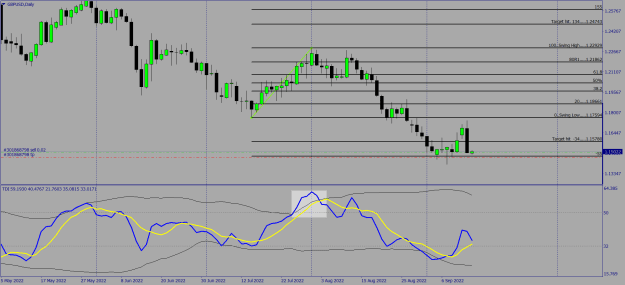
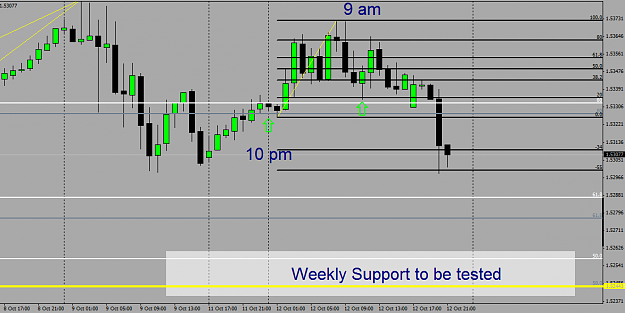
- ocd replied Oct 12, 2015
So what? It's a Monday and perhaps the volatility is limited to the 20% level as resistance and it bounces between that and the -34% or it really tries to test the 50% but it should fail. I'm thinking tonight the play is short at 20% and set target ...
Fibonacci and 50 bucks
- ocd replied Oct 12, 2015
So what happened? The 50% was tested on our intraday (in black) chart. It was breached and then became resistance. Dream entry would've been at the 38.2% but good entry to short would be at the 20% down to the -34%...but it spiked hard and fast down ...
Fibonacci and 50 bucks
- ocd replied Oct 12, 2015
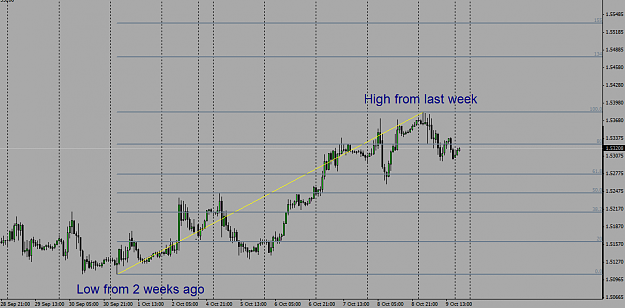
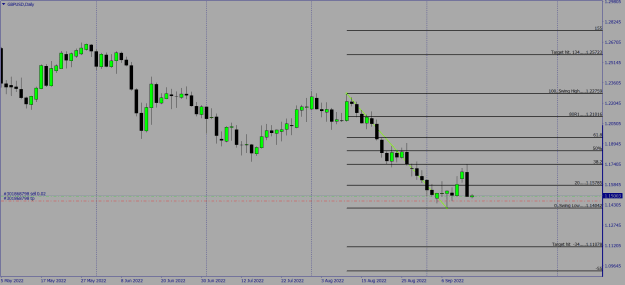
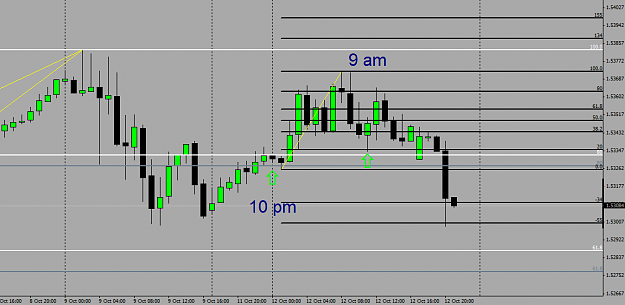
I just got home so let's take a look at what just happened. Using the 1 hr chart with Fibs in slate gray (2 weeks) and white (last weeks high and low) AND the third set of Fibs in black (our intraday) which we trade off. We use the high and low ...
Fibonacci and 50 bucks
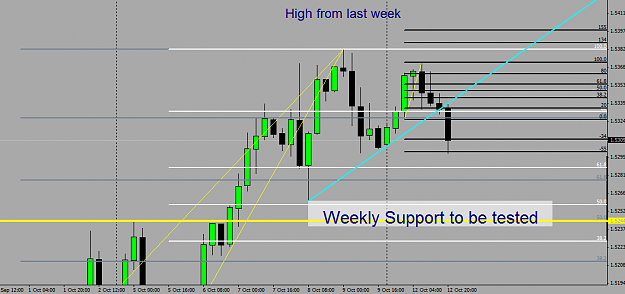
- ocd replied Oct 11, 2015
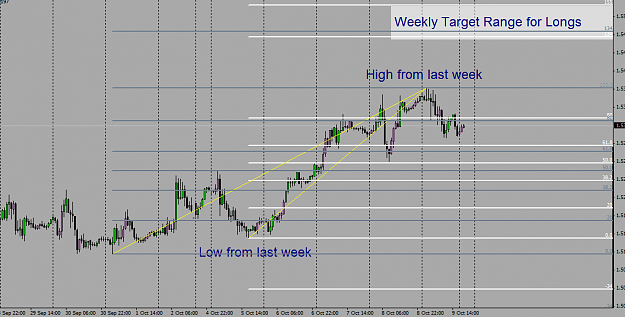
Now I will add the high/low points from last week (in white). Now why is this one special? Because the fib levels of 134% and 155% will be the targets of the big boys this week. Since the candles have opened ABOVE the 50% level for the week, expect ...
Fibonacci and 50 bucks
- ocd replied Oct 11, 2015
Well, it's a new week so let's get the chart set up. First fib will be the high and low points for the last 2 weeks (in slate gray, choose your own color preference).
Fibonacci and 50 bucks