- Search Crypto Craft
- 10 Results
-
 jiemisii replied Jan 19, 2016
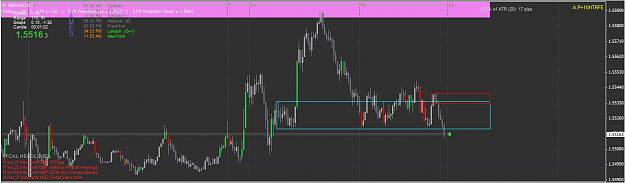
Did I drew the right zone ? so next step is to observe PA (2BR / 3BR) at the 0.0 / 0.5/ 1 fibs level ? I am not sure if this flow is correct or not.
Prez Forex (pres78) Trading Journal
- jiemisii replied Aug 30, 2015
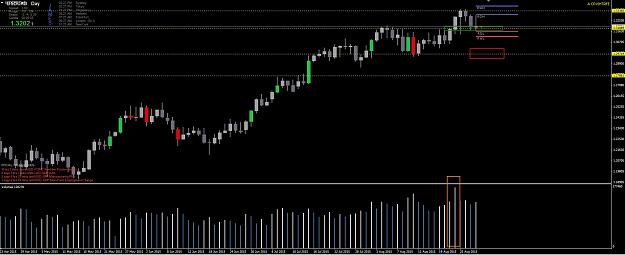
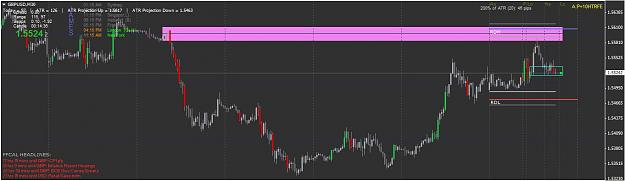
image Looking for short opportunities... image 1.319 critical level ... with strong volume and nice bar.. bear can attack
Commit to the Trade
- jiemisii replied Aug 28, 2015
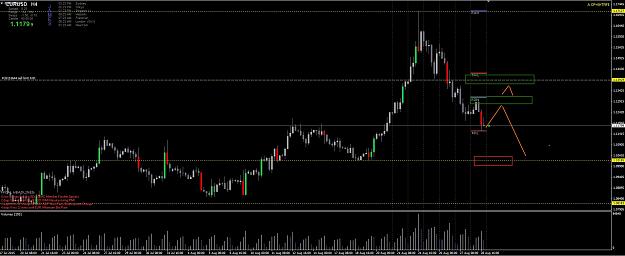
Bear seems to be getting weaker.. forming a wedge.. waiting for a nice PA at support before entering.
Commit to the Trade
- jiemisii replied Aug 27, 2015
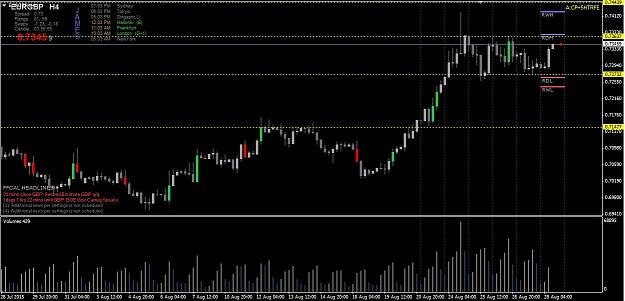
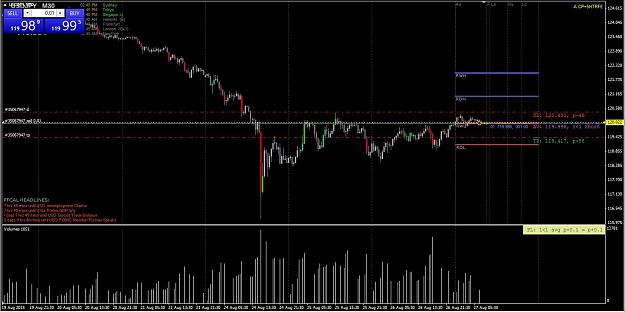
Had a short at the resistance. Increasing volume does not push price further up... I am more inclined to bear.. R:R 1:1
Commit to the Trade
- jiemisii replied Aug 26, 2015
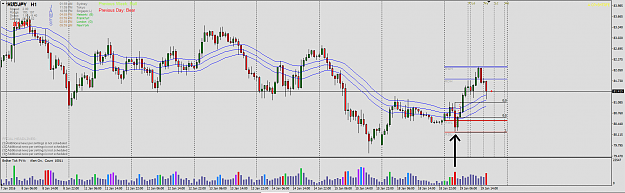
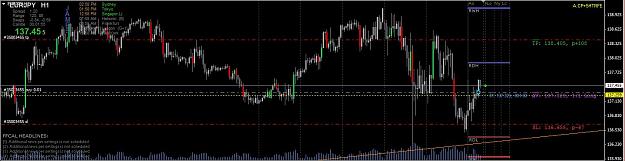
I've a long EJ here. Based on S/R, there is a breakout towards the resistance. Enter at the pullback... lets hope it rides well
Commit to the Trade
- jiemisii replied Jul 13, 2015
waiting for the engulf of blue box... Price near h4 supply.. image Edit: Waiting for price to RT back to red box. image
ReadtheMarket - Supply and Demand with Price Action
- jiemisii replied Jul 13, 2015
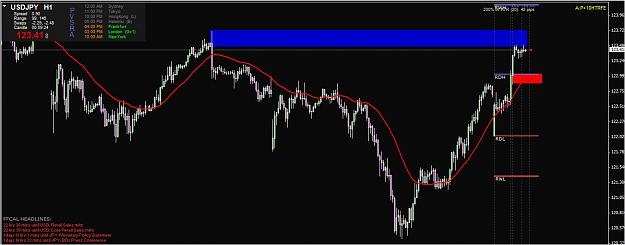
Looking at UJ . Blue box - H1 Fresh supply. For better confirmation, wait for a engulf of red box... then enter at dp..
ReadtheMarket - Supply and Demand with Price Action
- jiemisii replied May 8, 2015
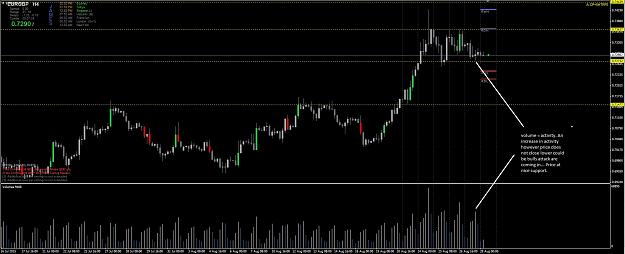
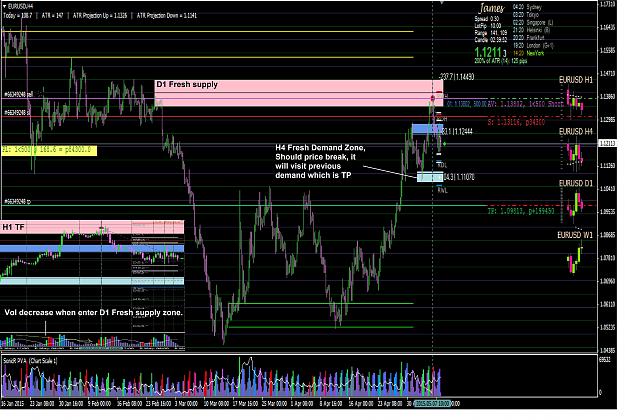
Sorry if the graphic sucks. This thread is recommended by TraderinSD with regards to analysis on volume and sup/dem zones So I entered EU short 2 days back. Reason is because price enter D1 fresh supply and checking the H1 tf, volume is decreasing. ...
Timing the Trade
- jiemisii replied Mar 12, 2015
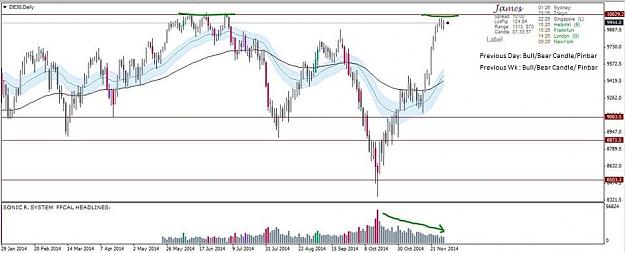
Hi, I am looking for a indicator that shows whether the previous day and week is a bull or bear candle. & if previous day/week is a pinbar, it will says bull or bear pinbar. image example of the indicator. I use paint to edit. Thanks ps: its for ...
I will code your EAs and Indicators for no charge
- Posts by Member Search: 'jiemisii'