- Search Crypto Craft
- 22 Results
- drbob8000 replied Feb 7, 2022
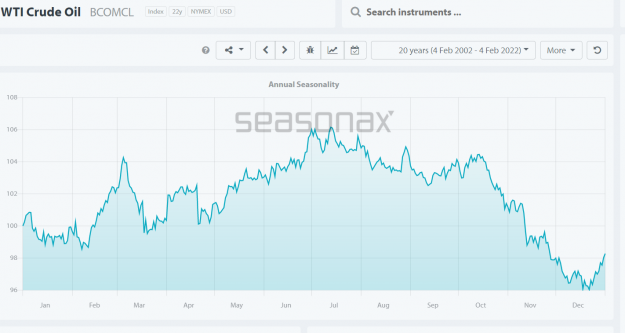
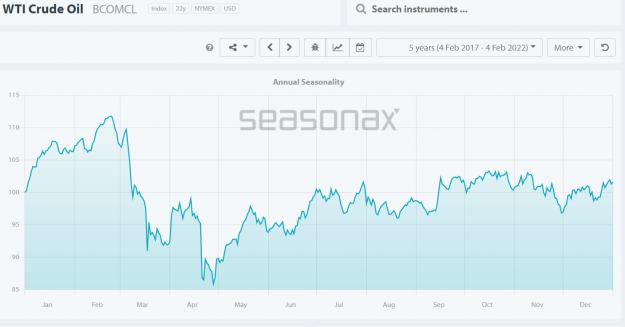
Consider the seasonality of crude. Here's the last 5 years.
WTI Crude Oil Trading
- drbob8000 replied Aug 22, 2021
Woo hoo! Finally understand I should be looking at the offline chart, and load your template onto it, correct?
Renko trading using proven strategy
- drbob8000 replied Aug 22, 2021
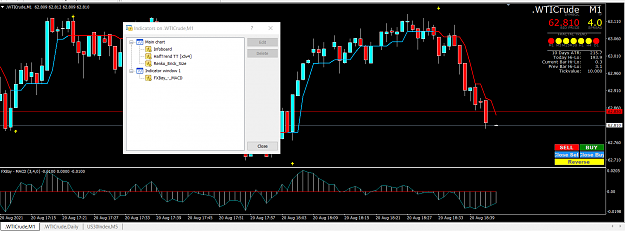
Thank you for your reply. I just now have had a chance to try this, and this is what I have, after downloading and opening your template and putting the settings as in post #585. What am I missing? I'm so ignorant. :-(
Renko trading using proven strategy
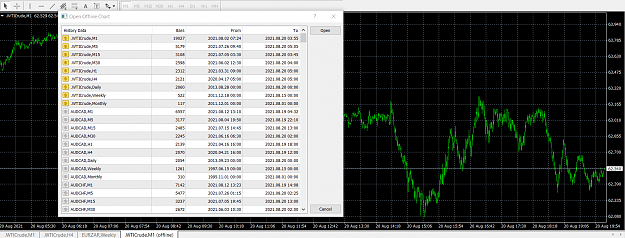
- drbob8000 replied Aug 20, 2021
When I go to file and click open offline, this is what I see. What do you mean, "Find M2 and open M2 chart"? I've scrolled down through all the cfd's & currencies available in this window and don't see any M2. Thank you for your help.
Renko trading using proven strategy
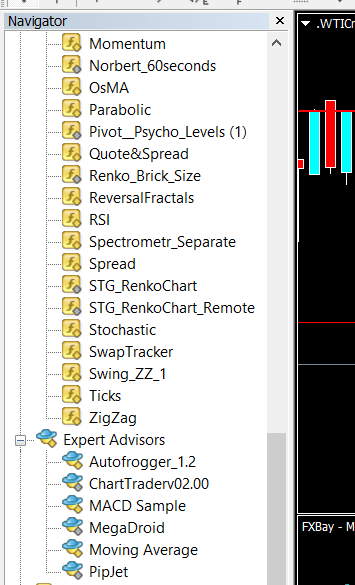
- drbob8000 replied Aug 20, 2021
This is what I have in my Navigator.
Renko trading using proven strategy
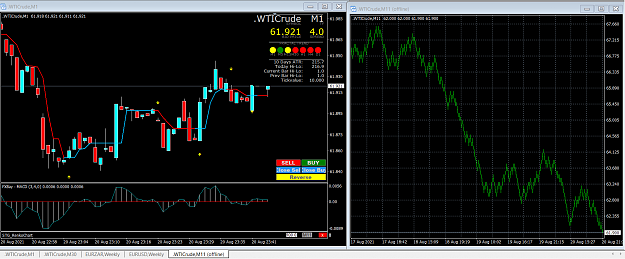
- drbob8000 replied Aug 20, 2021
I don't know what I'm doing wrong. I watched the video of the guy setting up RENKO charts you posted, but I don't understand the term "source chart" & offline chart", or how one gets them. This is what my 1 min RENKO 10 point chart looks like; ...
Renko trading using proven strategy
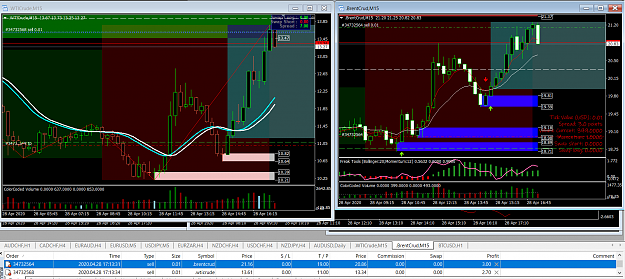
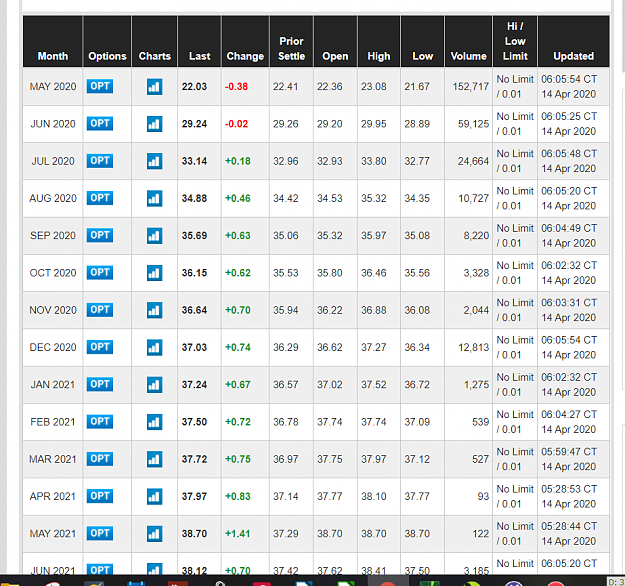
- drbob8000 replied Apr 15, 2020
Spreads between monthly contracts are narrowing
WTI Crude Oil Trading
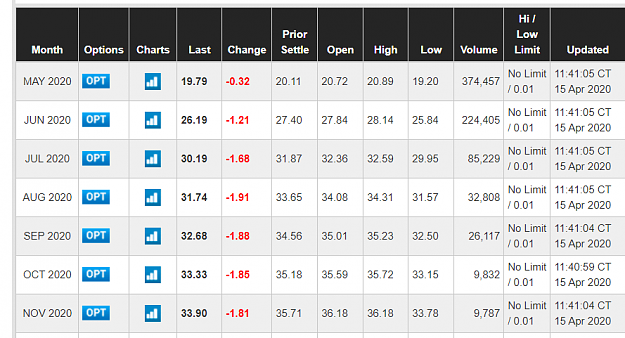
- drbob8000 replied Apr 14, 2020
Don't think I've ever seen this big of a price difference between consecutive month contracts in oil futures. When roll over to the June contract comes aroung, there's gonna either be a rip your face off rally, or a slow descent in price of June ...
WTI Crude Oil Trading
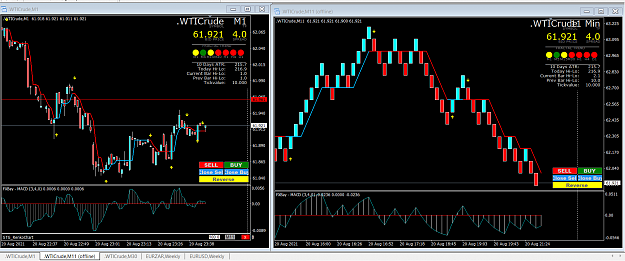
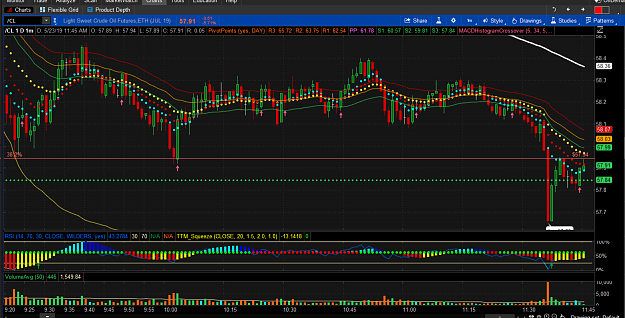
- drbob8000 replied May 23, 2019
I think the puke low was just put in on crude. Look at volume spike on this 1 minute crude futures chart.
WTI Crude Oil Trading
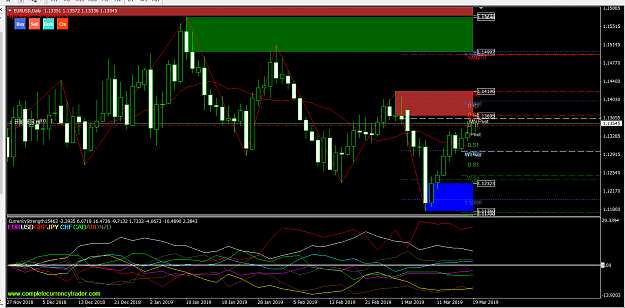
- drbob8000 replied Mar 19, 2019
There is a ton of supply in the wicks of 2/28-3/1 daily candles. If that area is not blown through with gusto, we'll make new lows....jmho image The FOMC release tomorrow may be the catalyst to launch
EURUSD only
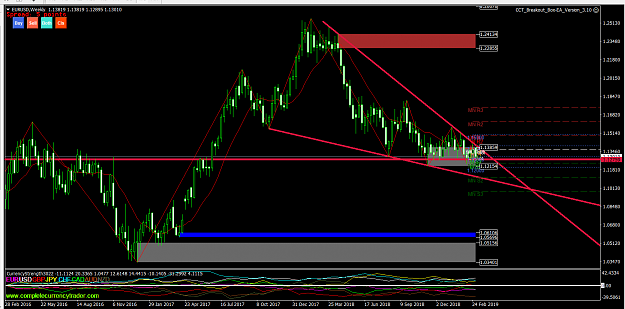
- drbob8000 replied Mar 7, 2019
WOW! I was hoping for a drop, but didn't think it would reach the bottom of the weekly channel today!! Unfortunately I closed my 2 x .10 lots waaay too early, but did manage to bank some cash today.
EURUSD only

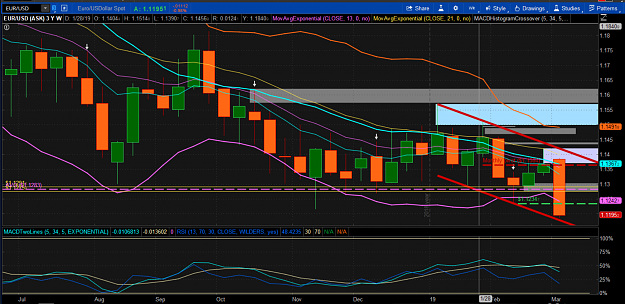
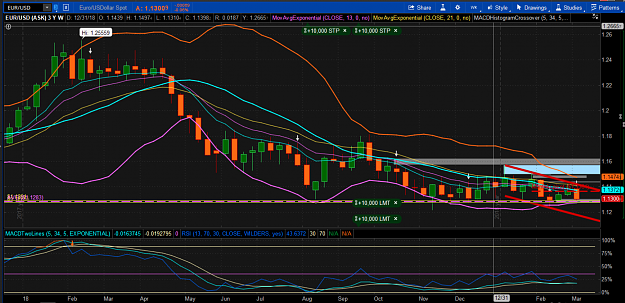
- drbob8000 replied Mar 6, 2019
Weekly EURUSD with channel and falling wedge; I think (therefore I am; don't know who said that :-) ) we'll see it approach the lower lines before a YUUUUGE breakout to the upside. jmho...oh, and I'm short still, but underwater...but collecting swap ...
EURUSD only
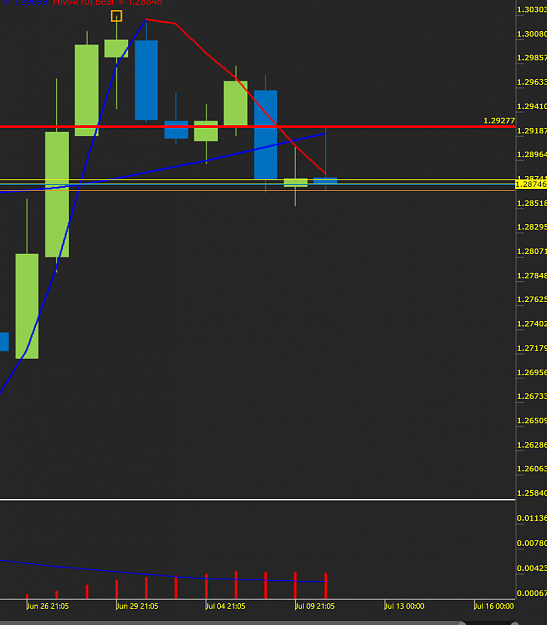
- drbob8000 replied Feb 25, 2019
Price should trade down to DS2 level around 1.3060 jmho image
USD/CAD
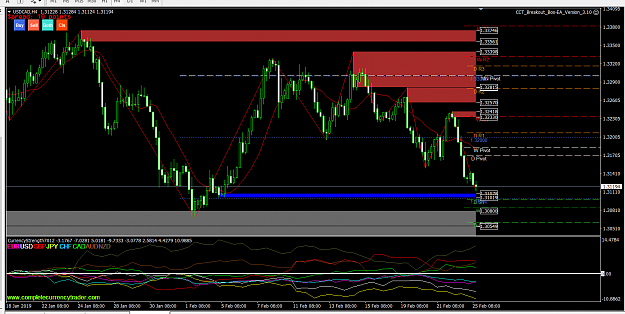
- drbob8000 replied Feb 13, 2019
Well, since I added to my shorts this morning after the news release, it's probably going to 112.00. :-( Sorry, it's called the Dr. Bob effect
USD/JPY Discussion

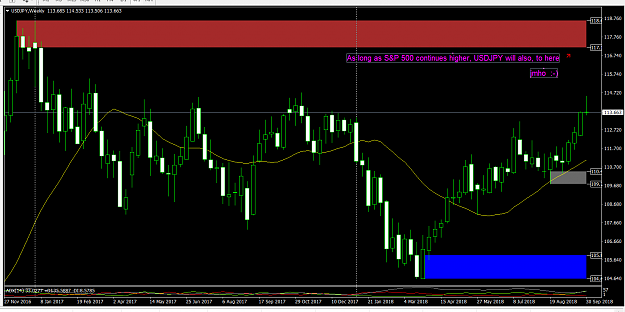
- drbob8000 replied Oct 7, 2018
Nothing to see here folks; move along...(jk; check the attached weekly chart
USD/JPY Discussion )
)
- drbob8000 replied Jul 11, 2017
Looks like trading since the open has been nothing more than a trap up move. Price reached the open of the July 5 daily bar (thick horizontal red line on chart), and has traded lower since.
Cable Update (GBPUSD)
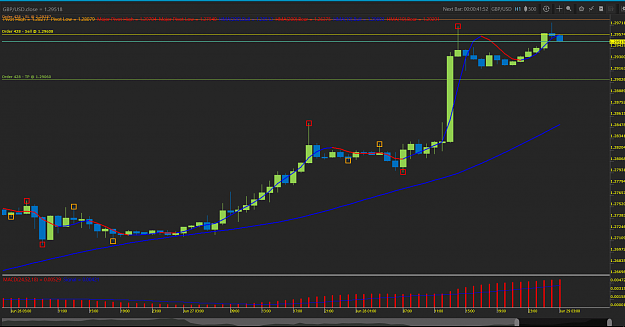
- drbob8000 replied Jun 28, 2017
Just went short at the beginning of the hour @ 1.29608. 1 hour chart just made a double top with doji's. I know this is against all the trends but 1, the 7 day candle chart. The 200 HMA on it is still red, indicating a downtrend? All constructive ...
Cable Update (GBPUSD)