- Search Crypto Craft
- 20 Results
- andrius replied Apr 30, 2009
down — Hi, I see EU going down to 1.2650 area with minor bounces around 1.3150 and 1.3015 areas. Just my opinion. A.
EURUSD
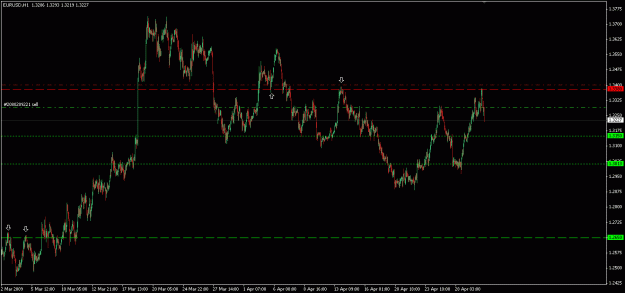
- andrius replied Apr 21, 2009
4 bottoms — Do you think IT will hold the fifth time? I'm keeping a short position open just in case it wouldn't.
EURUSD

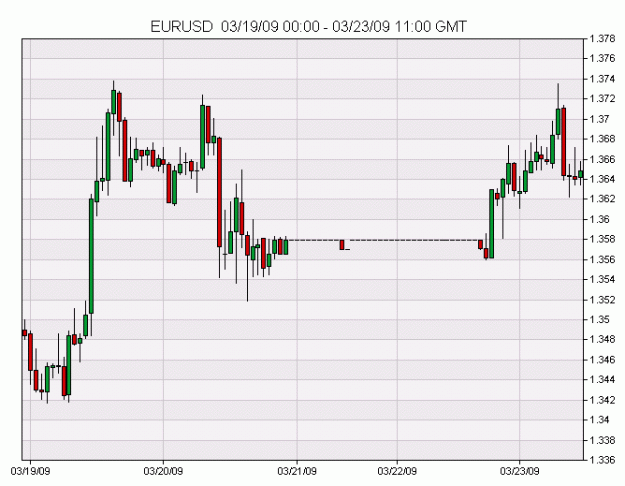
- andrius replied Mar 23, 2009
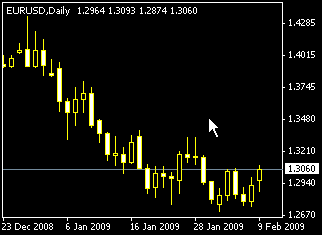
There is no gap — I cant see any gap today. Actually there is no gap. Look at this: url
EURUSD
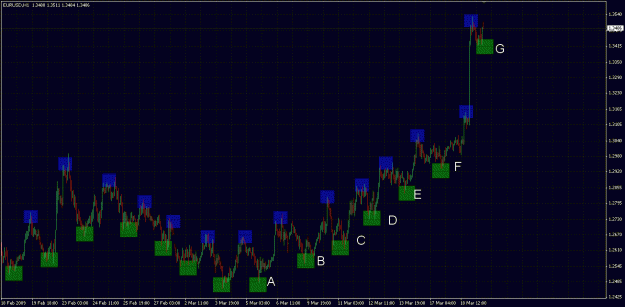
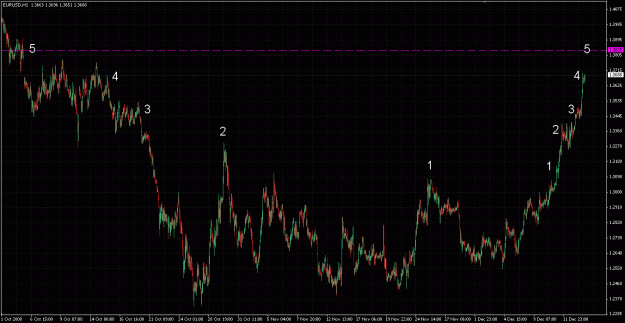
- andrius replied Mar 19, 2009
Any trend riders? — Hello all! I have a very simple question for you guys. Are there any trend riders over here, who "rode the trend" from the very beginning, adding on pullbacks at A, B, C, D, E, F? Anyone added at G, or is it already (EDIT: ...
EURUSD
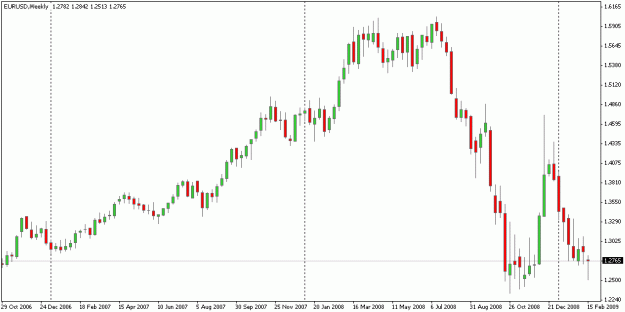
- andrius replied Feb 20, 2009
If it closes like this we'll have a dragonfly on Weekly. Let's wait and see if it breaks up on Monday.
EURUSD
- andrius replied Feb 18, 2009
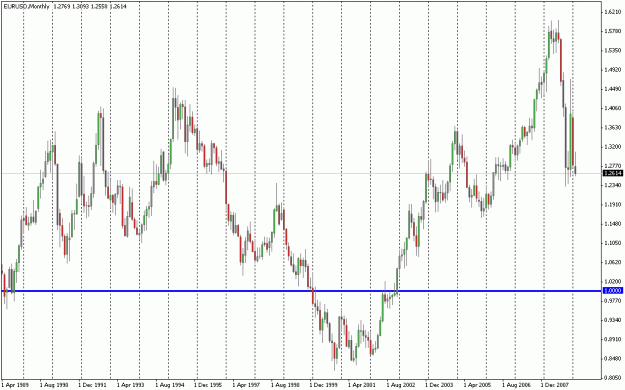
Monthly — Anyone trades monthly bars over here? Can it hit 1 till the end of 2009? What do you think?
EURUSD
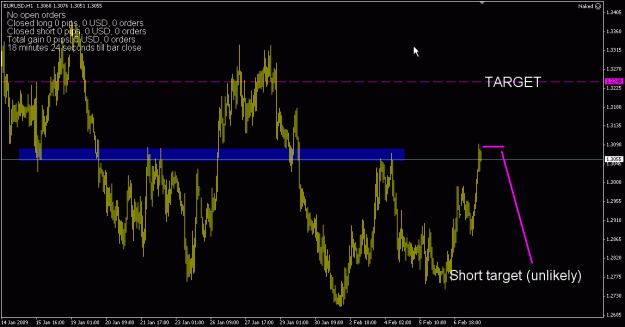
- andrius replied Feb 9, 2009
Successful shorts unlikely — It is moving UP too strong. It's now at previous resistance and trying to break it.
EURUSD
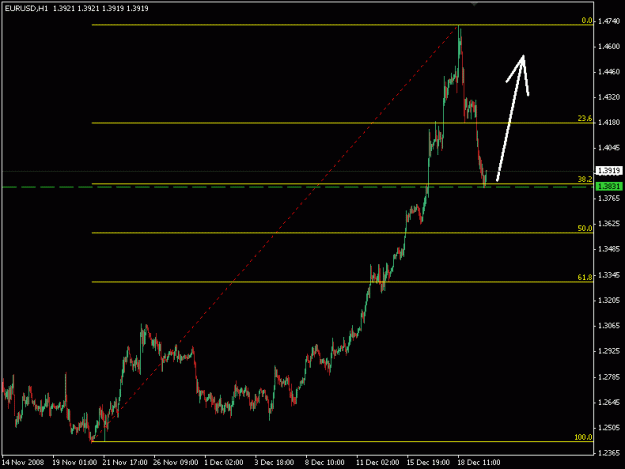
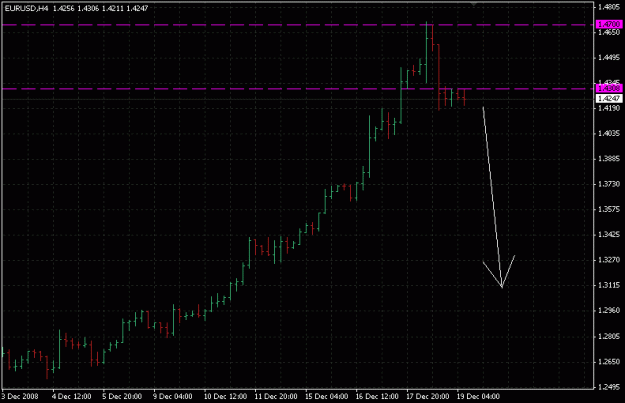
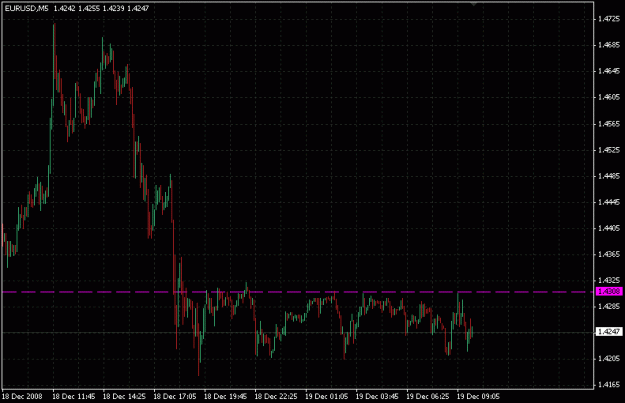
- andrius replied Dec 20, 2008
It was a really nice ride yesterday. I closed my shorts around 1.4... had to leave to the city. The price came back to the price 1.3830 from which the last run up started. Now it should continue upwards... (at least it's one of two possibilities as ...
EURUSD
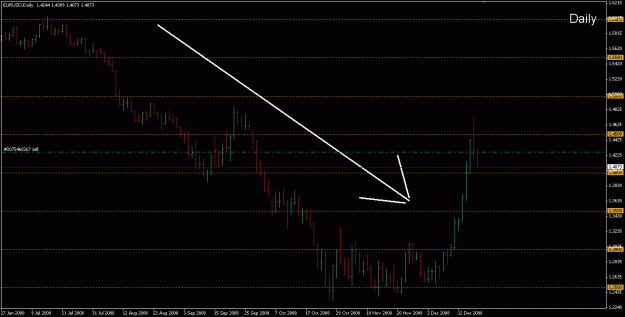
- andrius replied Dec 19, 2008
It's a game of chance, but after an exponential 2000 pips move up and a 500 pips bounce in 4 hours... odds are on the bounce side.
EURUSD
- andrius replied Dec 19, 2008
The price at which a stock or market can trade, but not exceed, for a certain period of time. Often referred to as "resistance level". Go check Investopedia, it's a great site with all terms explained and lots of articles. Resistance level has ...
EURUSD
- andrius replied Dec 17, 2008
Ziggy — A simple indicator to help visualize were a trend is going. I wrote the indicator myself. It's "freeware" - use on your own risk
EURUSD
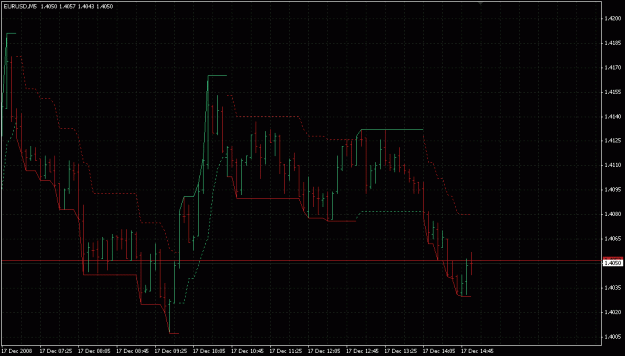
- andrius replied Dec 17, 2008
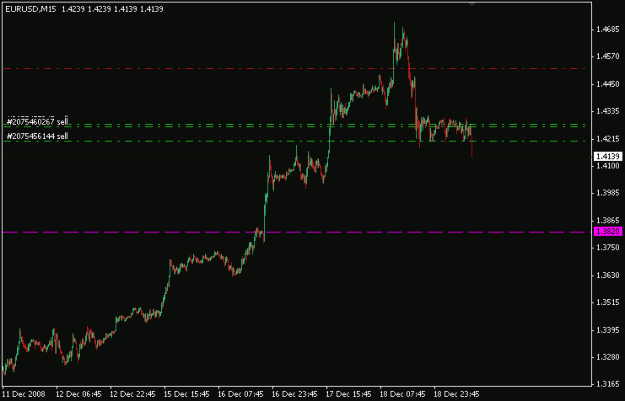
The move is losing strength. The price has also touched 50% fib level. Edit: attached img
EURUSD
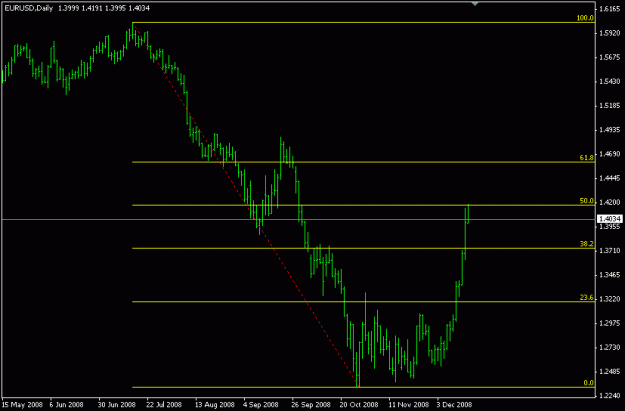
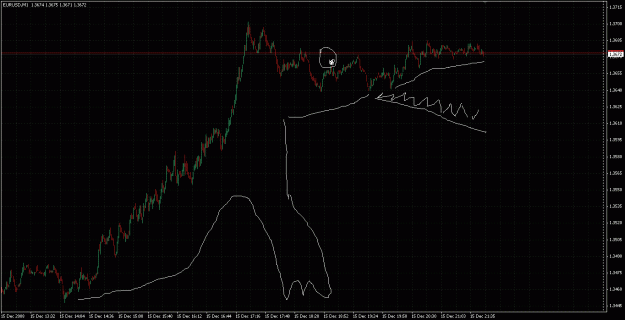
- andrius replied Dec 15, 2008
Look at it this way: levels 1, 2 & 3 have already been broken. If level 4 is broken, the next s/r level will be 5, which is around 1.3835. Edit: p.s. why Algis suggests 1.3747 we have to ask him
EURUSD

- andrius replied Dec 12, 2008
You don't listen what I am trying to ask
EURUSD Yes, I do usually look at a normal chart with a single pair on it. My question was about correlations / divergences between different pairs? Thank you
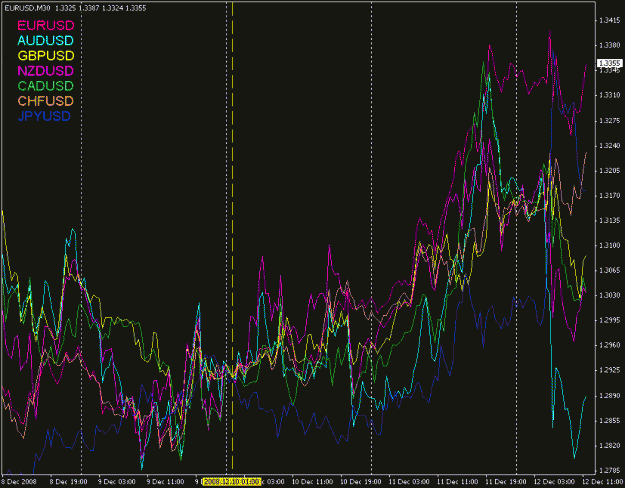
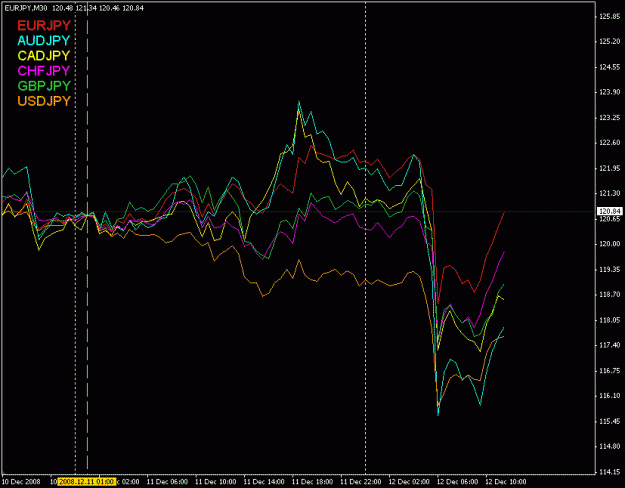
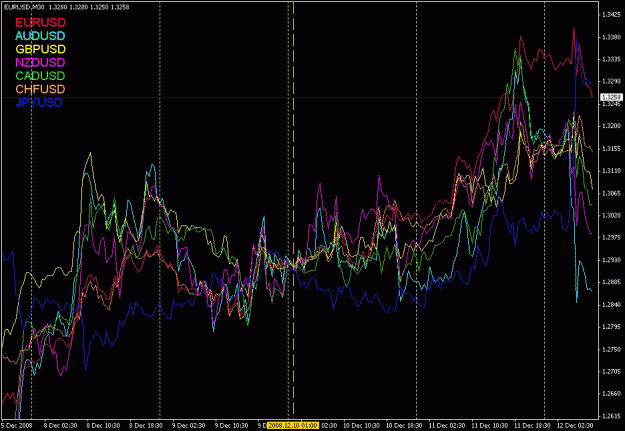
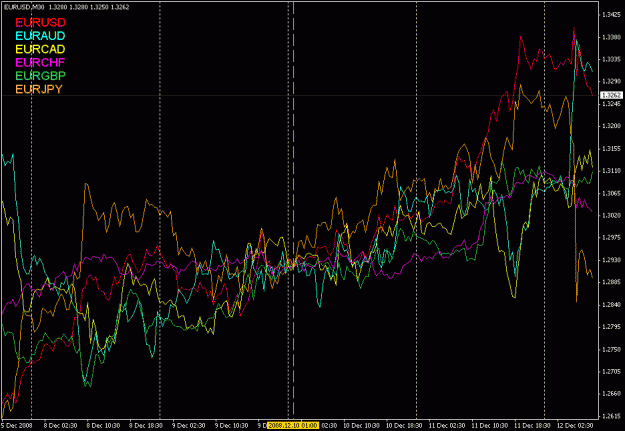
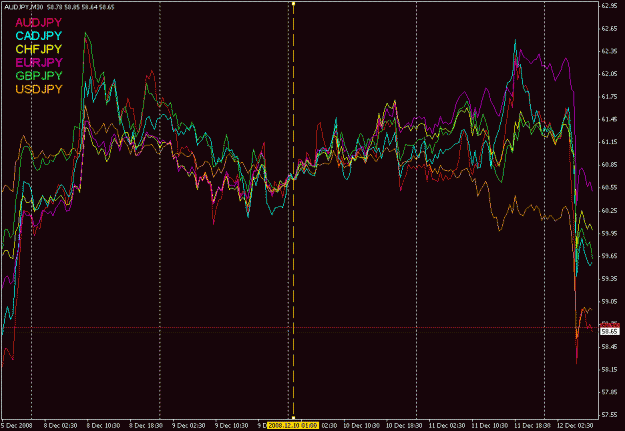
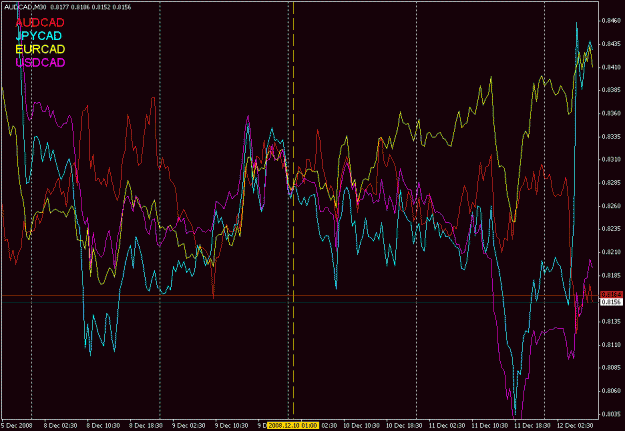
- andrius replied Dec 12, 2008
correlations — What is/are the best ways to use correlations between currencies? Could someone make some comment on these graphs? Thanks you gurus
EURUSD
- Posts by Member Search: 'andrius'