- Search Crypto Craft
- 59 Results (1 Threads, 58 Replies)
-
 Xarras replied Jun 22, 2020
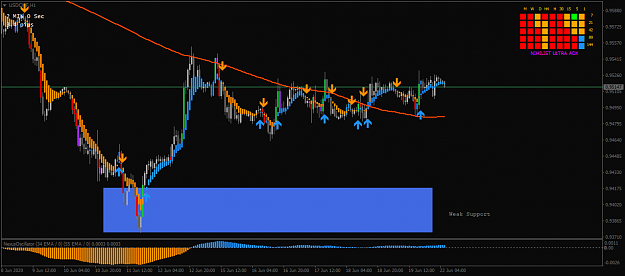
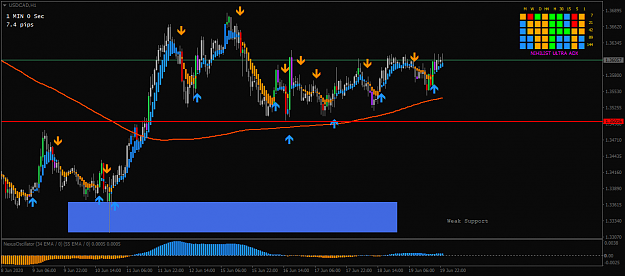
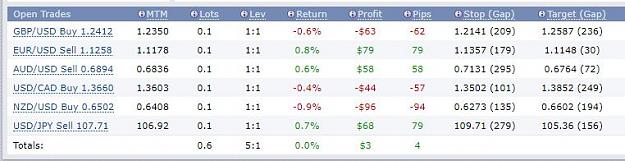
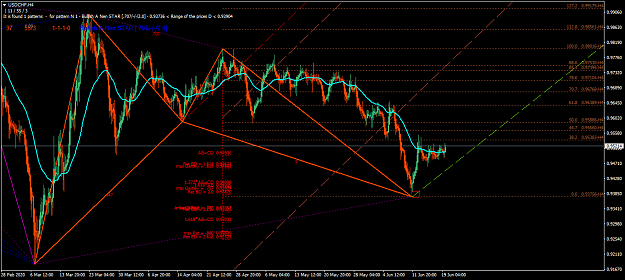
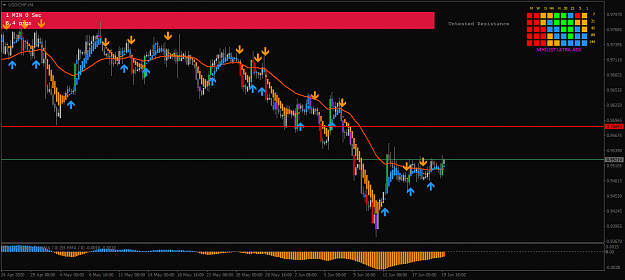
lets talk about 3rd trade MMAT has taken & it is USDCHF image MMAT has opened a buy/long order at 0.9516 & Take profit level at 0.9616 (101 pips) & Stop loss at 0.9246 (269 pips) Now, lets take a look at chart, here we can see that price recently ...
Master Mind Algorithmic Trading System (MMAT)

- Xarras replied Jun 21, 2020
2nd trade MMAT (Master Mind Algorithmic Trading System) has taken is USDCAD Buy/Long order at 1.3660 & Take profit at 1.3852 & Stop loss at 1.3502 image And currently at -57 pips loss! another 101 pips down & it will hit SL level. Anyway, by ...
Master Mind Algorithmic Trading System (MMAT)

- Xarras replied Jun 21, 2020
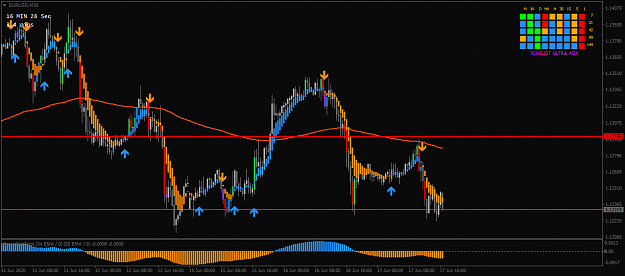
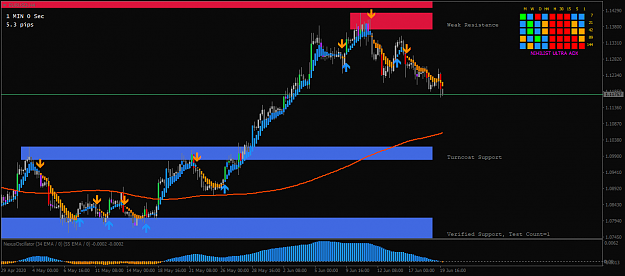
I am doing live trade & let's analyze the 1st trade MMAT (Master Mind Algorithmic Trading System) has taken... image It's EURUSD Short/Sell order at 1.1258 & Take profit at 1.1148 & Stop loss at 1.1357 So, by looking at H1 EURUSD chart it's a ...
Master Mind Algorithmic Trading System (MMAT)

- Master Mind Algorithmic Trading System (MMAT)Started Jun 21, 2020|Recycle Bin|9 replies

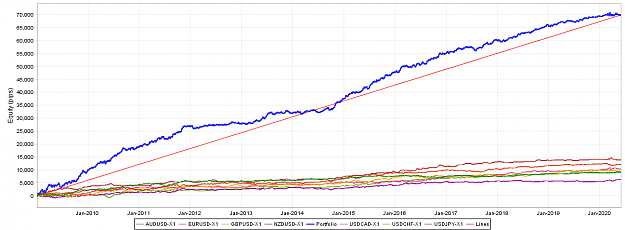
Note: If you are looking for 50-100% ROI per month, then this thread is not for you! If you want to ...
- Xarras replied Jun 21, 2020
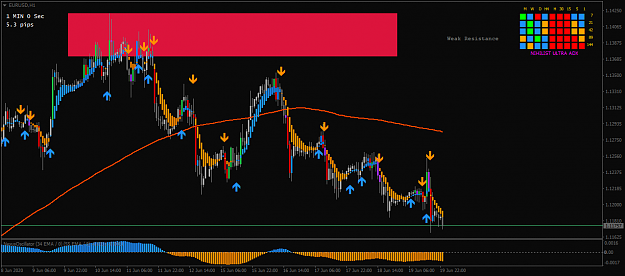
My expert advisor did a great trade for EURUSD, need another 30 pips down for TP hit image
EURUSD
- Xarras replied Jun 20, 2020
in other case, a bullish harmonic pattern already formed a while ago, adding more confirmation in bullish trend! image
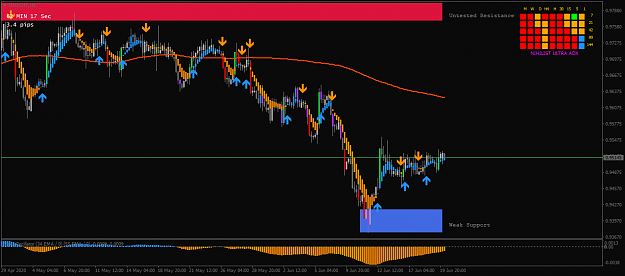
USD/CHF
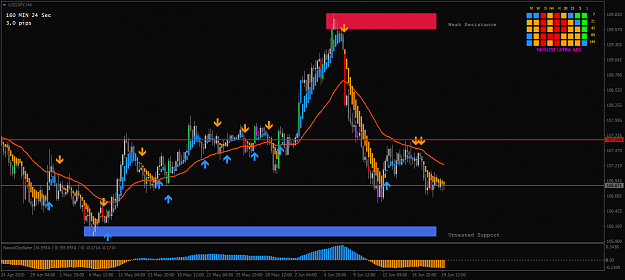
- Xarras replied Jun 20, 2020
in USDCHF bearish strength is getting weaker, if price cross 0.9584 level consider uptrend just started, & take profit target should be around 0.974x area image
USD/CHF
- Xarras replied Jun 19, 2020
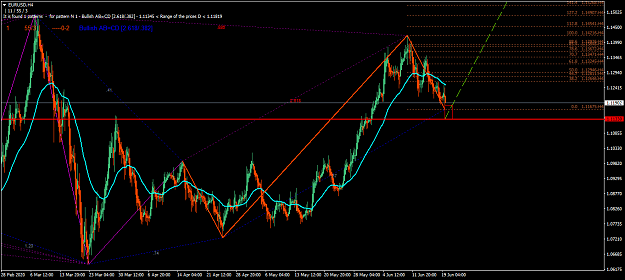
in EURUSD a Bullish ABCD Pattern formed & it will be valid until price hit 1.1133 (stop loss) wait until price hit 1.1257 area for confirmation image
EURUSD
- Xarras replied Jun 19, 2020
in GBPUSD it is still a solid down trend... though according to Harmonic pattern it might start bullish trend till price hit 1.230x area image image
Cable Update (GBPUSD)
- Xarras replied Jun 19, 2020
in USDJPY based on our previous harmonic pattern analysis, price predicted to be bullish in long term, however, in short term price is bearish right now, therefore, it is advisable to wait until price hit 107.656 level then open buy/long order & ...
USD/JPY Discussion
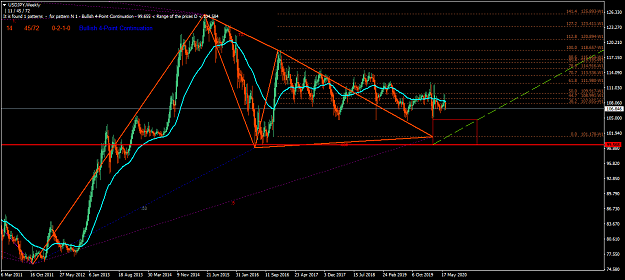
- Xarras replied Jun 19, 2020
in USDJPY weekly chart 4-Point Bullish Continuation pattern formed a while ago, this bullish pattern will be valid until price hit 99.568 level. image
USD/JPY Discussion
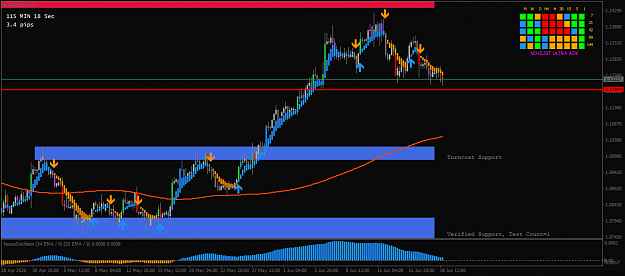
- Xarras replied Jun 18, 2020
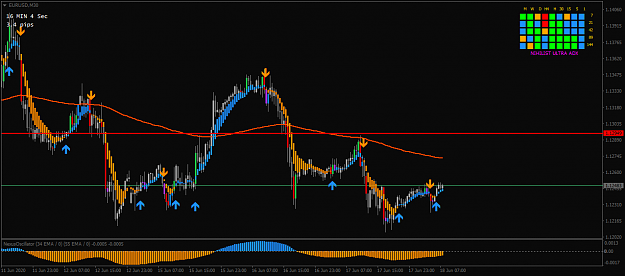
in EURUSD 1.118x area holding as a strong support, if it breaks possible down to 1.105x image
EURUSD
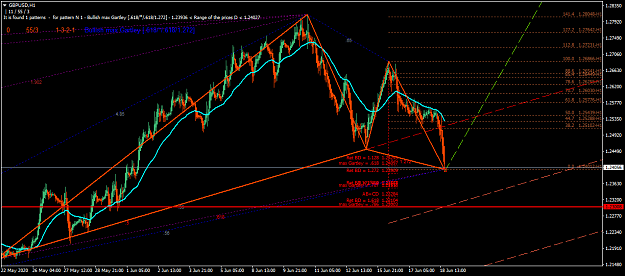
- Xarras replied Jun 18, 2020
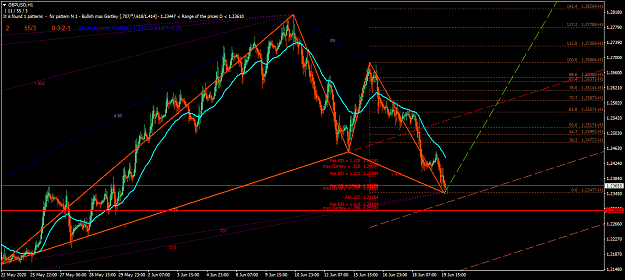
in GBPUSD Bullish Max Gartley pattern formed, possible bullish trend might began, this bullish pattern valid until price hit 1.2300 level (stop loss) image
Cable Update (GBPUSD)
- Xarras replied Jun 18, 2020
wait until price hit 1.1294 & go for long as in the long term price is bullish image image
EURUSD
- Xarras replied Jun 18, 2020
GBPUSD is ranging now, wait until price cross either of these level 1.2503 or 1.2591 image
Cable Update (GBPUSD)
- Xarras replied Jun 17, 2020
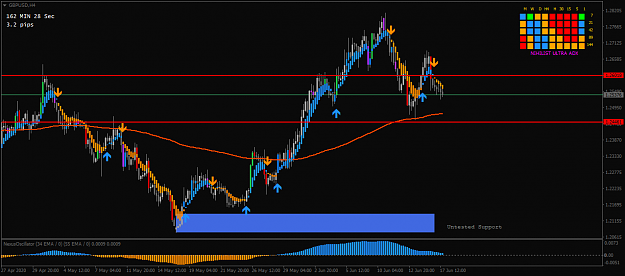
in long term GBPUSD still has bullish strength, though price might break 1.2446 level & start a strong down trend all the way down to another strong support level at 1.213x level image
Cable Update (GBPUSD)
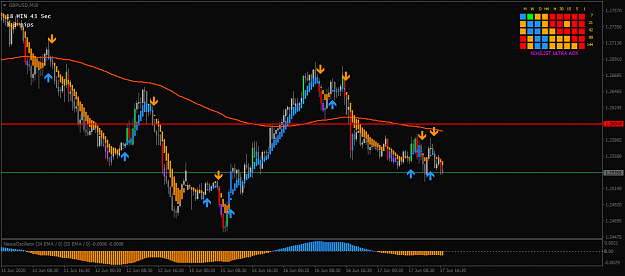
- Xarras replied Jun 17, 2020
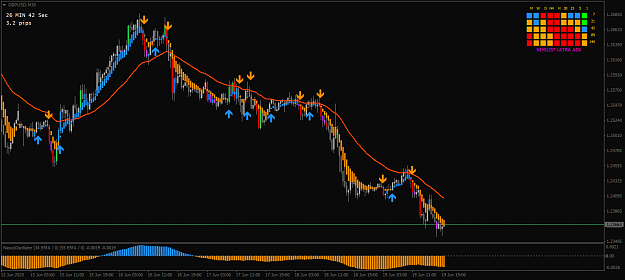
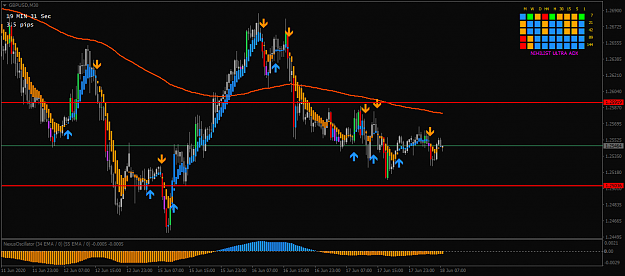
in short term GBPUSD has strong down trend right now, unless price cross 1.260x level, down trend will remain intact image
Cable Update (GBPUSD)
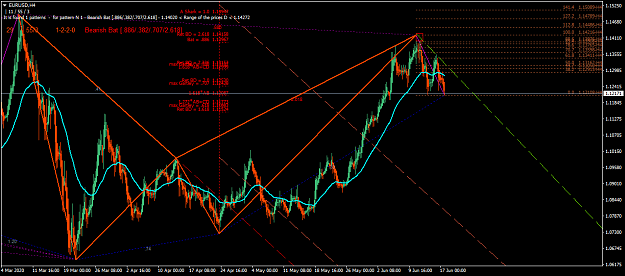
- Xarras replied Jun 17, 2020
another possible strong indication on down trend by a bearish bat pattern! image
EURUSD
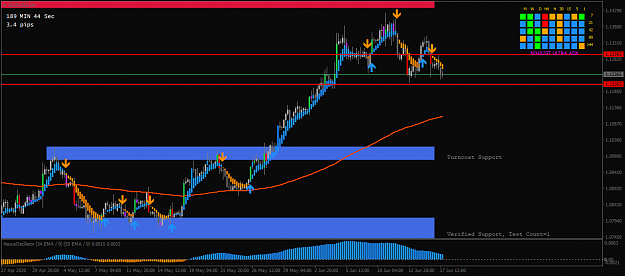
- Xarras replied Jun 17, 2020
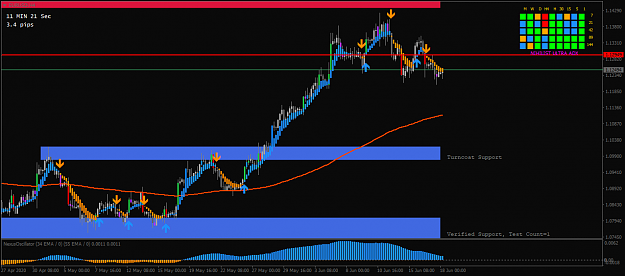
in long term EURUSD has uptrend still & if price break 1.1205 level then it might go down to 1.111x level & farther down to 1.102x level where it has strong support. Or, it might break 1.129x level & resume it's uptrend again image
EURUSD
- Xarras replied Jun 17, 2020
in short term EURUSD has strong down trend now, keep selling until price hit 1.1295 level image
EURUSD