- Search Crypto Craft
- 11 Results
-
 Viator replied Sep 22, 2020
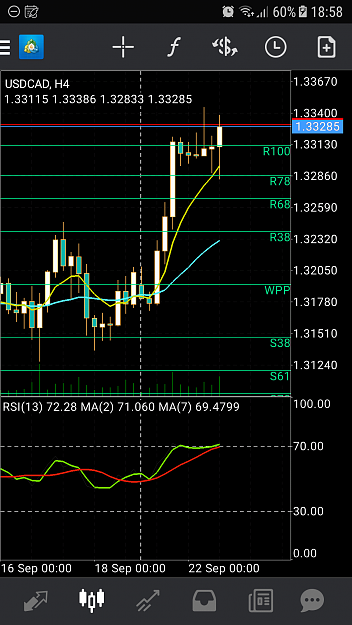
Hello Emmanuel, just a rookie using rsi and ma --》screenshot Is that also correct? I found this setting somewhere in the net. Other question: Any idea to show HA candles on mobile? Regards Peter
Trading Made Simple
- Viator replied Dec 18, 2019
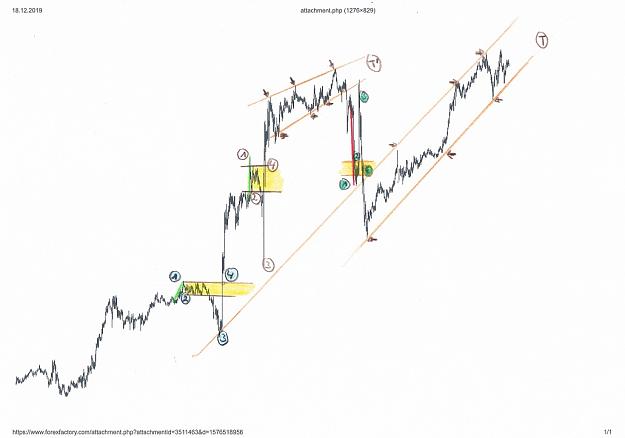
Hello, here some input from my site: marked 3 areas according Michael´s setup --> 1-4 (each) Also added two trendlines --> T and T´ Along these trendlines I would enter my trades.(arrows) Looking forward to hearing other opinions. Regards
The real Basics - how to start and how avoid the traps
- Viator replied Dec 15, 2019
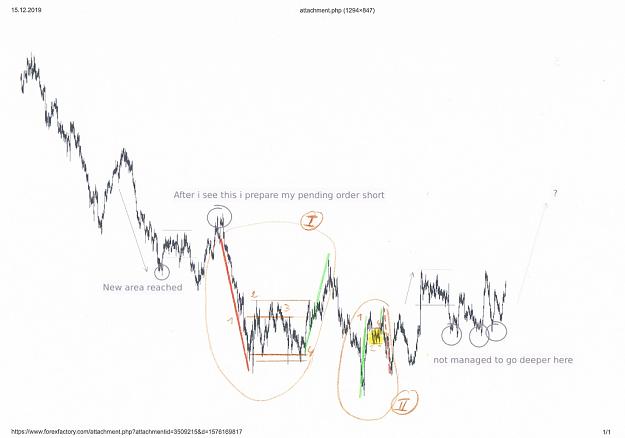
Hello, nice partizipation this time. I see that Michael´s setup needs trained eyes and experience. I tried to apply this setup to two areas in the picture.--> I and II I --> After going down (1) , pushing back (2) and pennding area I maybe would ...
The real Basics - how to start and how avoid the traps
- Viator replied Dec 8, 2019
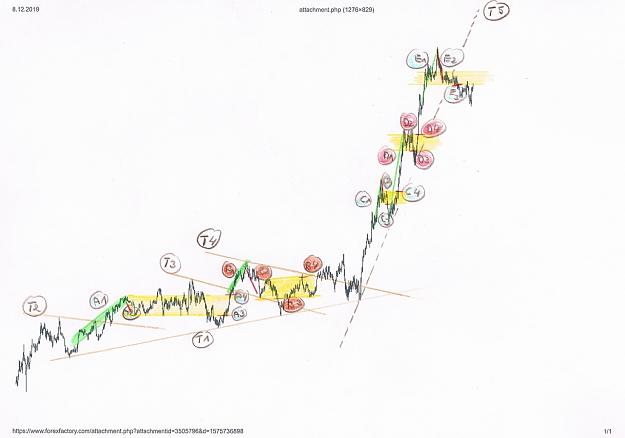
Hello, Some Input from my site: I just combined the two graphs and re-produced the given setup. --> A1-A4, B1-B4 Trend T1-T4 Then I added 3 interesting points with the given setup I also see chances here. --> C1-C4, D1-D4, and maybe E1-D3? Also I ...
The real Basics - how to start and how avoid the traps
- Viator replied Dec 3, 2019
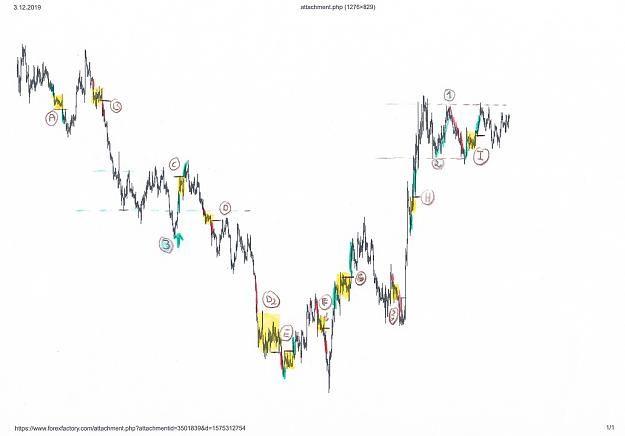
Hello Michael, some Input from my site: I tried to identify entry conditions according the two setup we have discussed before: 1) "4 Steps Setup" by Michael --> Marked the phases in "green / yellow/ green" or "red / yellow/ red" with horizontal ...
The real Basics - how to start and how avoid the traps
- Viator replied Nov 29, 2019
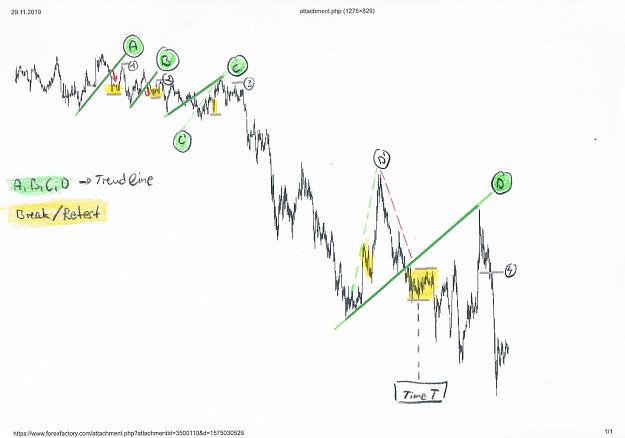
Hi Michael, due to quarter-end workload at work I´m replying with a delay. To be honnest it´s not easy to detect the 4 phases (Trendline, Break, Retest, Entry) This example is much more challenging than your last one: Reason: Trendline A, B and C ...
The real Basics - how to start and how avoid the traps
- Viator replied Nov 23, 2019
Hello Michael, thank you for that interesting setup. Some questions about: What is the right trade direction? Do you determine that by your own setup (15 min, 30 min, 1 HR, 1 Day, ...) of your chart? For example the EUR/ USD is currently going down ...
The real Basics - how to start and how avoid the traps
- Viator replied Nov 20, 2019
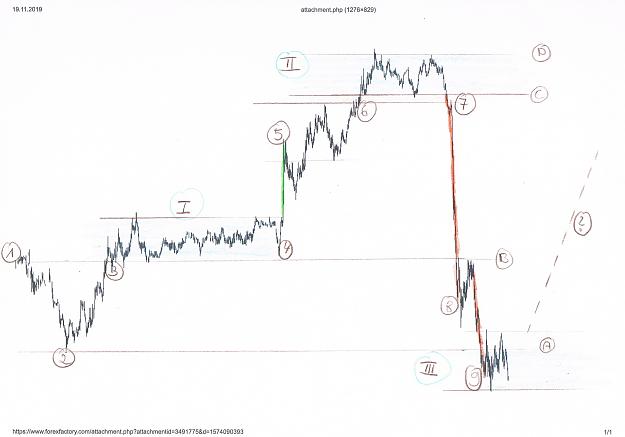
Hello, here some input from me: 1-2-3 : price movement down and up again. 3--> 4 : price inside blue area I. 4-->5 : sharp price movement up 5--> 6: movement up to blue area II. 7: area II seems to broken and sharp movement down follows to 8 and ...
The real Basics - how to start and how avoid the traps
- Viator replied Nov 12, 2019
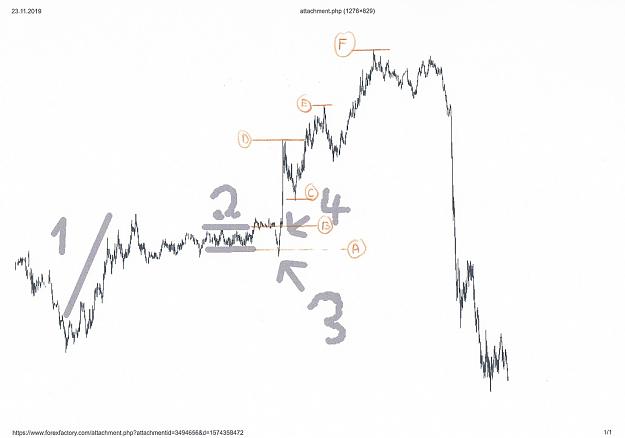
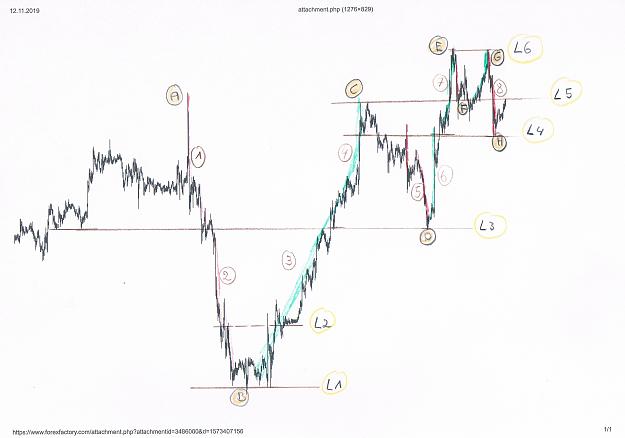
Here some input from my site: I marked some levels (L1-L6) which maybe influenced the price. (Sure there maybe more such levels) Price has fallen from Point A to B. I would have sold a little bit above number1 but as I´m not a risky trader I would ...
The real Basics - how to start and how avoid the traps
- Viator replied Nov 9, 2019
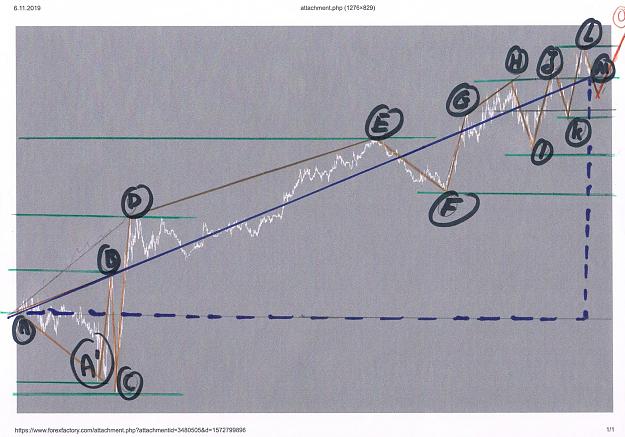
Hello, here my view: I see some levels A to F and areas (A<-->B, around C and D) where prices bounces away from or go in zick-zack. Point 1: Price moves down to point 2. Between 2 and 3 there se.ms to be a further level that I missed in the picture. ...
The real Basics - how to start and how avoid the traps
- Viator replied Nov 6, 2019
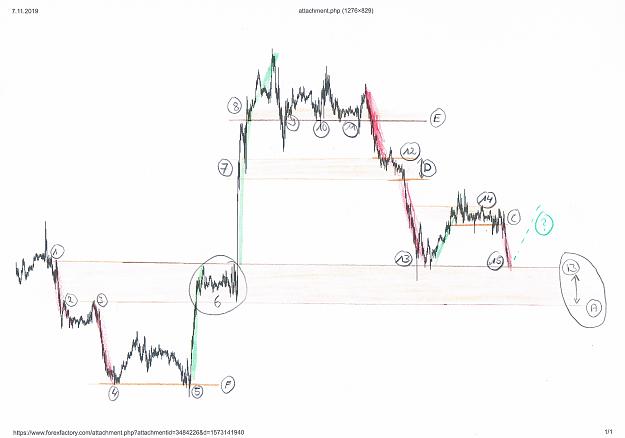
Hi, I´m just very new to forex but I try to explain what I see in the chart: price went down from A--> A´--> B to C. After that price went up to D. (large rising) From D to E, I see continous movement up. Movement down (F) is still higher than D. ...
The real Basics - how to start and how avoid the traps
- Posts by Member Search: 'Viator'