- Search Crypto Craft
- 95 Results
-
 Thtpro replied 38 hr ago
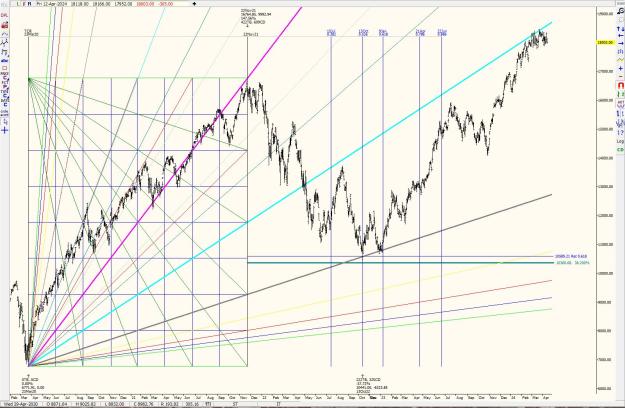
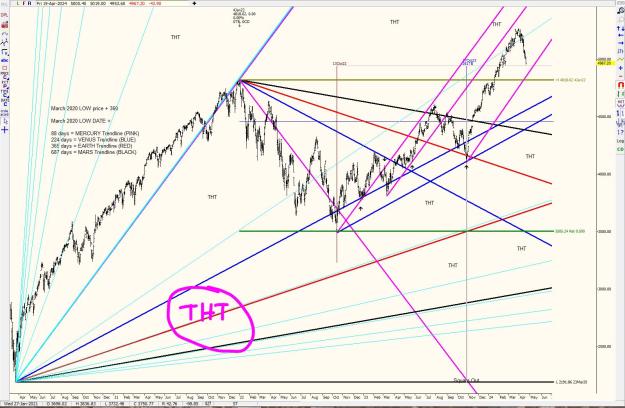
Here's a simple Gann Box on the SP500 split into 8th's - with an extended 50% of the box angle image Notice the 2020 stopping point which is also Ganns "Old Tops become support" adage If markets were truly random, then none of this would happen, ...
Michael S. Jenkins teachings

- Thtpro replied Jun 11, 2024
ANY - If something works, it will work on EVERY market and time-frame The only thing you need to understand is that like you and I, we are different and have our own life paths - each market does too, If you take the current position of the SP500, ...
Michael S. Jenkins teachings

- Thtpro replied Jun 10, 2024
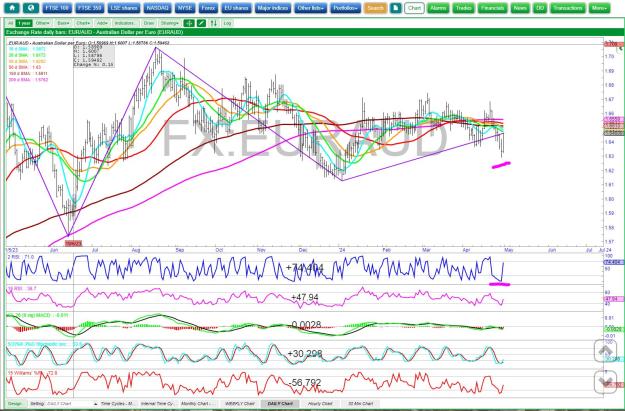
Cycles also confirm that outlook - that down swing bottoms out in 4 years time - Obviously its not straight down, but overall it bottoms in 2028 - in that time I'm looking for more Inflation, War etc Just waiting for a 123 short to form on the Daily ...
New Cable Thread & Other Pairs

- Thtpro replied Jun 4, 2024
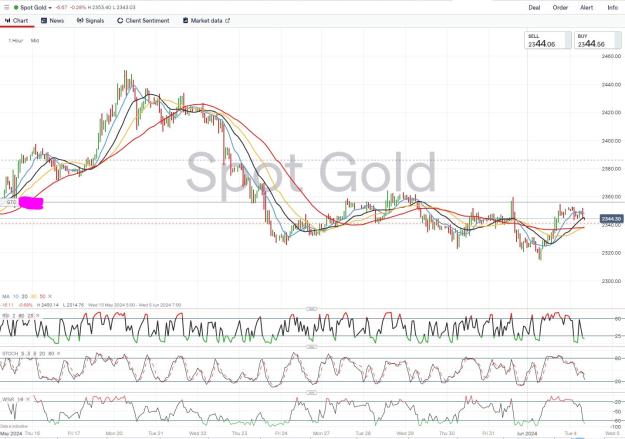
Sideways consolidation box forming on GOLD 1Hr - with bullish trend Trade is cancelled if price goes too further lower - UPDATE EDIT = VIOLATED, order cancelled image
New Cable Thread & Other Pairs

- Thtpro replied May 24, 2024
You need to work out what you're happy using Lots of different methods work - It all depends on what geometric structure the market is working through on your field of vision on the chart - This is why sometimes methods work and then they stop ...
Michael S. Jenkins teachings


- Thtpro replied May 23, 2024
Natural Gas following its 4 year L-L cycle No Idea how high it will go, but bear in mind we have a very MAJOR WAR CYCLE due which could influence supply/demand Note that the "typical" cycle results in a rally up into a high for a duration of 2 ...
Analysis and Trading based on Envelopes, Waves, Cycles


- Thtpro replied May 22, 2024
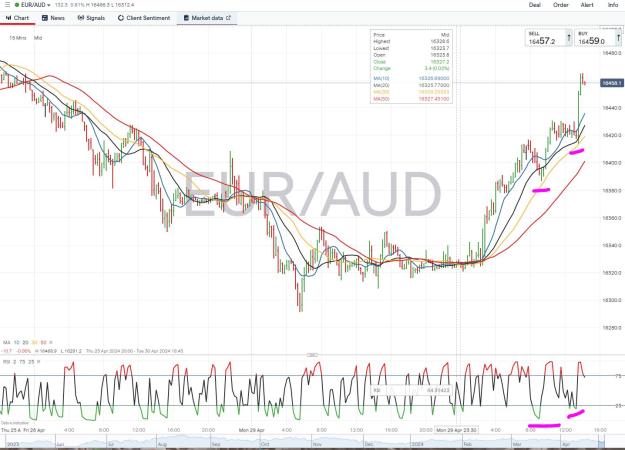
Just exited this one from this morning SMA's move into perfect order DOWNTREND Price moves SIDEWAYS into the 10SMA with 2RSI >75% = Place order to sell 1 pip (+ spread) under the low of the set-up bar (This was the last GREEN bar in the sideways ...
How to properly use indicators

- Thtpro replied May 22, 2024
Hi Pervaz - you need to "QUOTE" the comment and that way I would have been alerted to your comment - apologies for the delay in replying, I've only just come back to the thread by chance I turned off PM's as I had one person ask for help, only to ...
How to properly use indicators


- Thtpro replied May 18, 2024
Seen a few comments on Harmonics - here's a couple of "cheat sheets" that you might find handy file image
New Cable Thread & Other Pairs

- Thtpro replied May 15, 2024
HI Great questions The analogy was a generalised comment, however, I am happy to answer in greater detail If you apply the "Gold Ball" to your set-up, then you might have multiple set-ups and you could (i do) apply the gold ball to each set-up - ...
My Biggest Problem
- Thtpro replied May 15, 2024
Just to add to the SP500 comments and put in my 2 pence worth My composite cycle Index of the SP500 is at this position seen below - trade what you see NOT what you think/expect - but just be aware we have a lot of cycles that the SP500 works to, ...
Trading Made Simple(r)
- Thtpro replied May 14, 2024
Yep absolutely - That's why Gann created all those squares of....... using Fib ratios as the fan will work too as the markets are working through all the building blocks to their final destination Price and Time do some weird things - If you take ...
New Cable Thread & Other Pairs
- Thtpro replied May 14, 2024
Fibonacci is a geometric growth/decay system, depends what you want out of your analysis, but the other geometric growth/decay systems are the square, cube, 2 adjacent squares etc which make up platonic solids and is why you can find the maths of ...
New Cable Thread & Other Pairs
- Thtpro replied May 9, 2024
I would be very very wary of anyone claiming to be a guru and I would never ever pay anyone - the other problem you have especially on these forums, is the pretenders, who need to massage their ego's We all know that we make money by being right on ...
My Biggest Problem
- Thtpro replied May 7, 2024
I've used Indicators to trade since 2008 I would read Robert Miners Book High Prob trading strats - It is Elliott Wave, but, there's a bigger picture if you sit and think about it, there he tells you how to use Indicators at reversal points - you ...
How to properly use indicators

- Thtpro replied May 2, 2024
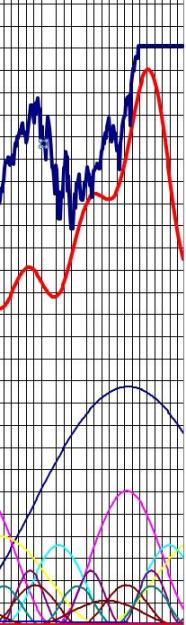
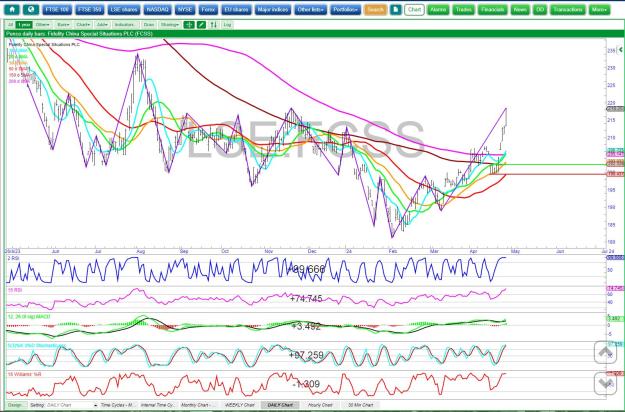
Here's a practical use of Jenkins Remember markets are DYNAMIC and not static, which means that they [price action] is twisting and turning on higher dimensions than we are able to see - this is WHY nothing works all the time, as it spins in and out ...
Michael S. Jenkins teachings
- Thtpro replied Apr 30, 2024
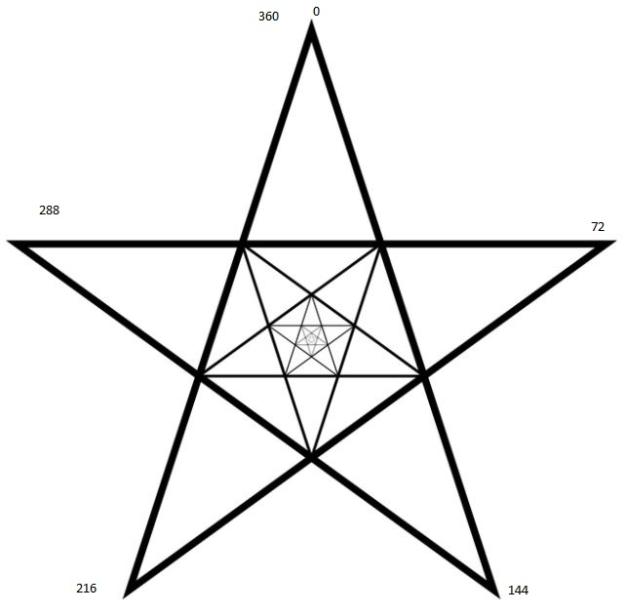
Then when you harmonically drill down the 72 degrees, a harmonic is 18 degrees and the following can be seen (note I took this screen shot in 2018, hence why not up to date price action wise) image You will be stretched to find this harmonic ...
Michael S. Jenkins teachings
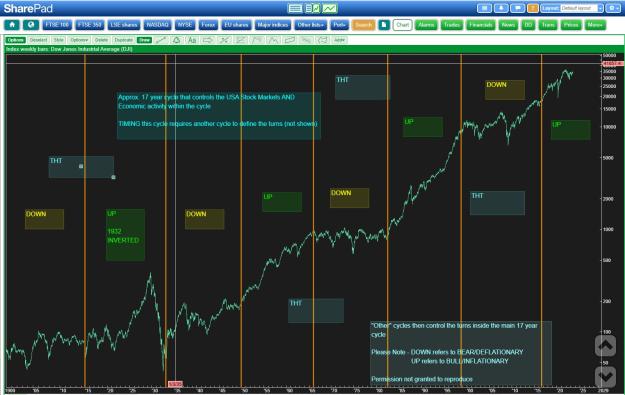
- Thtpro replied Apr 30, 2024
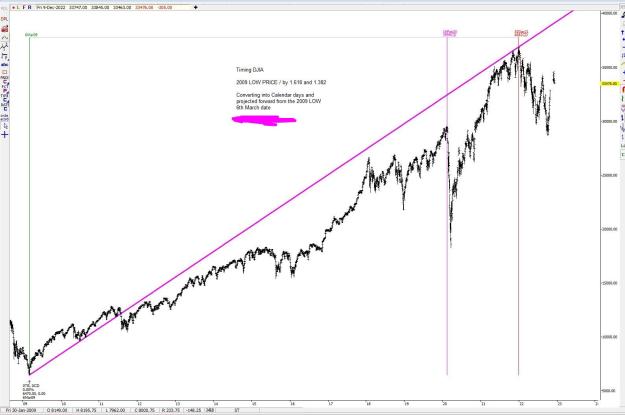
From the DJIA data look for this cycle - This is the CYCLE - notice the repetition UP/DOWN....... From there, you can mark the BIG LOWS 1942,1974 & 2009 and note the timing between - If you are still alive when the next one occurs = BEST time to buy ...
Michael S. Jenkins teachings
- Thtpro replied Apr 30, 2024
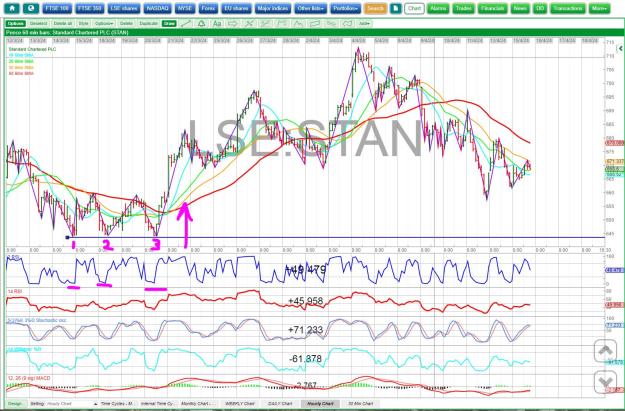
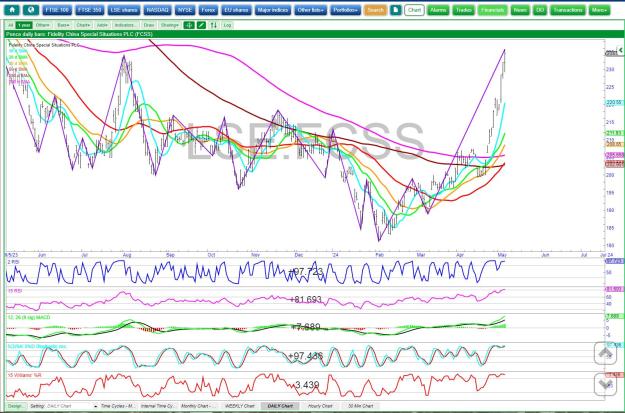
This is from TODAY Another multiple R profit trade Daily was in a position for the p[ast few days for a "pop" higher based on everything discussed image Then it wasn't until TODAY that the 15 min chart got its act together and formed a tradable ...
Indicator to identify tops and bottoms?