- Search Crypto Craft
- 55 Results
-
 TheFisherman replied Dec 8, 2017
Don't rush into it. M1 tells a different story. So far the story is... the break attempt is rejected.
EURUSD only
- TheFisherman replied Dec 8, 2017
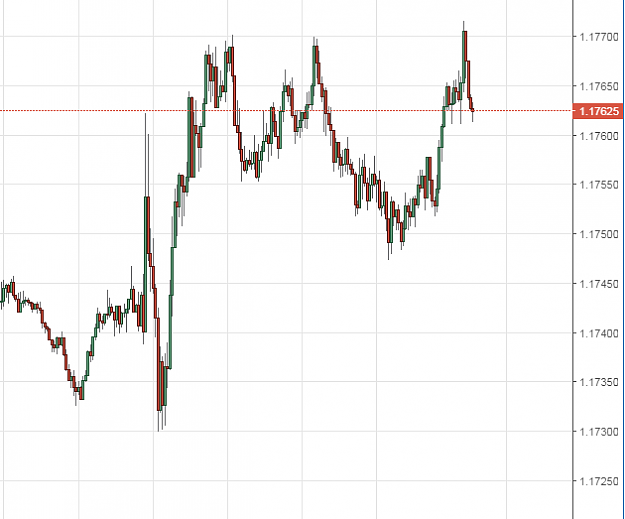
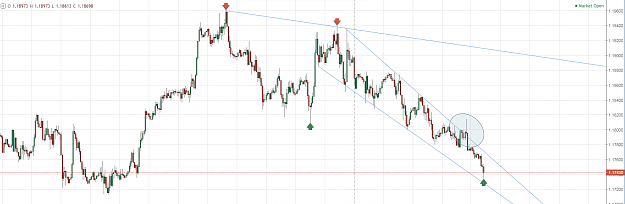
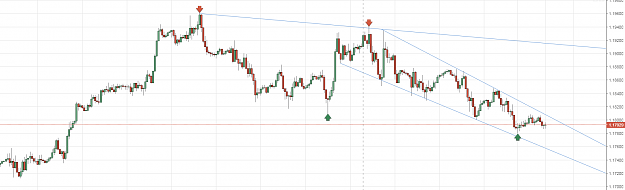
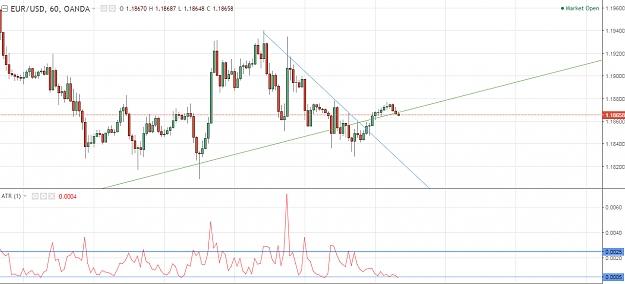
With a new lower low currently forming and the trendline break swiftly rejected yesterday, I think the Euro bulls can wait on the sidelines for the moment (unless NFP gives a strong bullish momentum). I would still personally take a long position on ...
EURUSD
- TheFisherman replied Dec 7, 2017
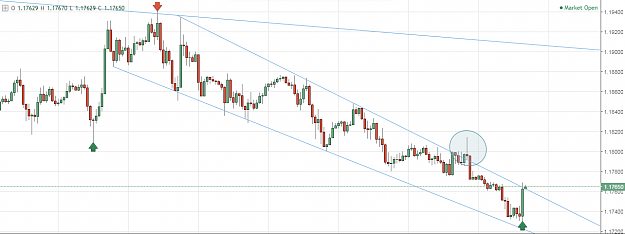
For EU bulls, still watch the upper line, but given the fact that yesterday we had a lower low, after a lower high last week, the best bulls can hope for at the moment is a range.
EURUSD
- TheFisherman replied Dec 5, 2017
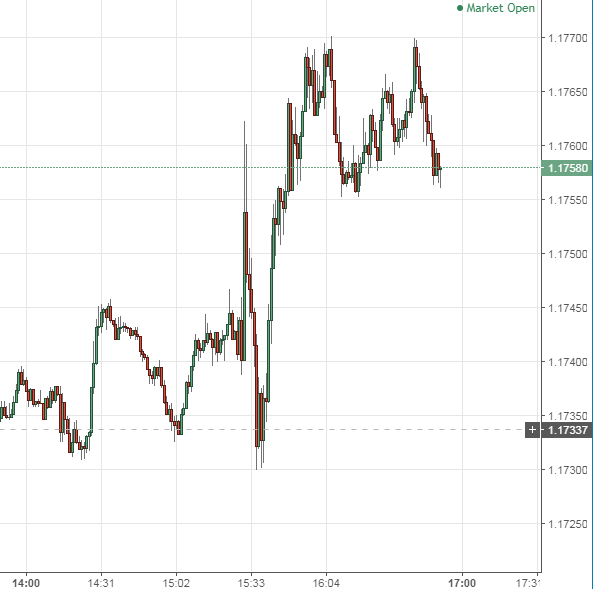
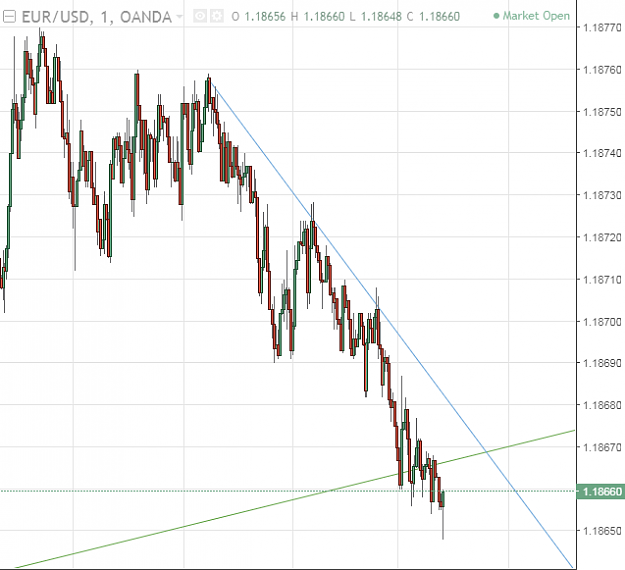
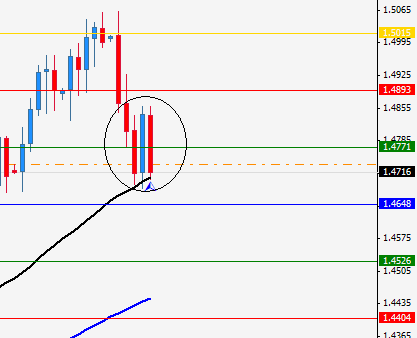
Good morning. EURUSD play of the day: BUY on the break of the 1 minute trendline above. R:R 1:2 or 1:3 with 5 pips SL, or 2 lots with the second one let run for 10s pips. image
EURUSD
- TheFisherman replied Nov 29, 2009
we may have different views but if what i'm showing you right now is not a range i don't know what is. good luck to you cause right now i'm 80 pips in profit and really don't feel i need that luck
EURUSD
- TheFisherman replied Nov 18, 2009
for a starters break of the orange trand line. for a second, break of the red sma (200).
EURUSD
- TheFisherman replied Nov 18, 2009
UCAD — pardon my off-topic: UCAD, upper range bound (blue ellipse) should hold. if not... rats!
EURUSD
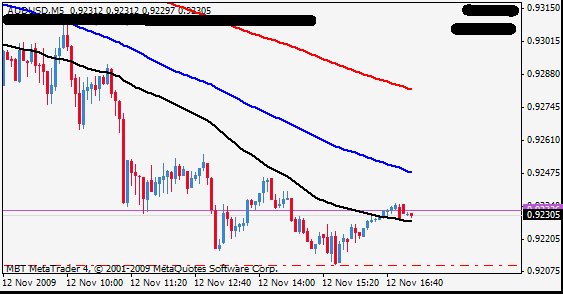
- TheFisherman replied Nov 12, 2009
Okay. I'm back from a birthday and time to write some: #1 EU trade completed TP 4840 entry 5035. Okay. #2 CAD trade TP modified from 0625 to 0590. Entry 0455 and 605 for an average of 530... I know, this trade sucks. #3 and the most interesting AUD: ...
EURUSD
- TheFisherman replied Nov 10, 2009
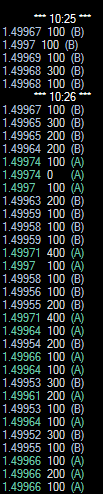
The problem remains the same. Correct charts should print the latest transaction price which could be either BID or ASK. Check the image below to see how transactions occur in the market:
EURUSD
- TheFisherman replied Nov 3, 2009
DOW — If DOW doesn't break the triangle up by close I think we all know where it's all heading this week. I have no more doubts about it. DOW is going DOWN. And it will take euro with it. Not gold. gold seems to have an agenda of its own.
EURUSD
- TheFisherman replied Nov 2, 2009
On Wall St. it's a full scale orchestrated sell-off. Don't believe me? Check this out:
EURUSD
- TheFisherman replied Nov 1, 2009
And back to EU analysis. If there's one thing one should think about it should be this: on daily bearish engulfing pattern (I think that's what's called). Think about it. black is 50 SMA.
EURUSD
- TheFisherman replied Oct 29, 2009
Goddamnit! I'm losing my patience
EURUSD . Fine, have it your way: fibs do work. It's not that "I don't understand PA" it's the pure fact that PA has nothing to do with fibs. It works sometimes by pure chance. Sure there can be some trading strategies ...
- TheFisherman replied Oct 21, 2009
here's something to cool you off: see pic i would have sold the e/u and bought the dow. Make some pretty sure $ until tomorrow.
EURUSD