- Search Crypto Craft
- 34 Results
- Tataocb replied Aug 26, 2010
Sweet trade on EU — This is a trade on EU I took a couple minutes back. I think the chart explains itself. Price is now testing that high volume pivot line. I already took 55 pips from the market so that is enough for me for today.
vsa with Malcolm
- Tataocb replied Jun 16, 2010
You probably wouldnt find it since from what I've seen today the posts are edited. In this post, he had said something waaay different about Malcolmb14: url and now it has been edited. It's just like he did when he "misquoted" you and has now ...
Trade Using VSA (Volume Spread Analysis)

- Tataocb replied Jun 4, 2010
A drop is possible — Yeah, a drop is certainly possible in UJ, maybe during the London session. There seems to be a confluence between the upper TL and the yellow line (which I call scalp line, basically a lower TF S/R line). I'll certainly ...
600 Pips a Month with Shahab and GeppyG
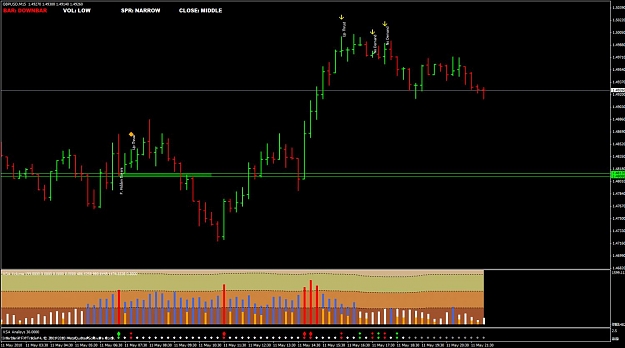
- Tataocb replied May 11, 2010
My trade from today was good for 50 pips, took the trade when I got the second signal (yellow arrow), combined with the up thrust in the back, I went short, set SL at 30 pips and TP at 50 which was hit over an hour and a half later. Nice trade. I ...
Trade Using VSA (Volume Spread Analysis)
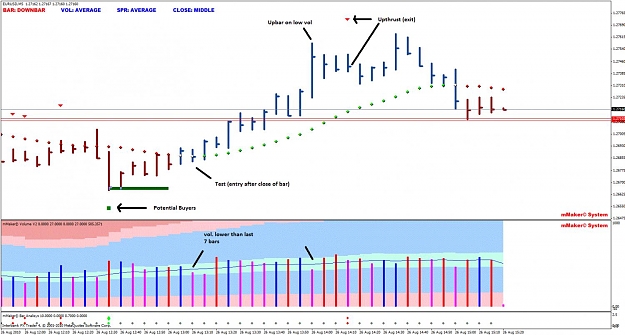
- Tataocb replied May 7, 2010
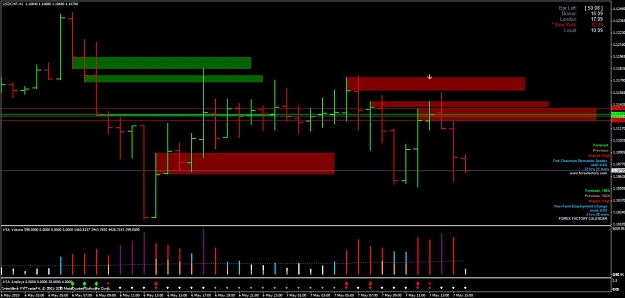
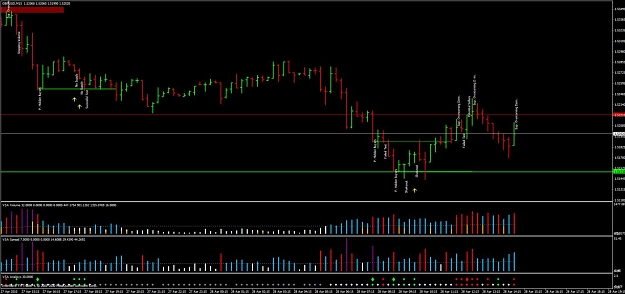
This is my trade from earlier today, as Tom Williams says, market does not like high vol. upbars, a few had been showing up, so went short after the up bar with high vol closing in the middle. SL of 30 pips and took profit manually at 50 pips on ...
Trade Using VSA (Volume Spread Analysis)
- Tataocb replied May 3, 2010
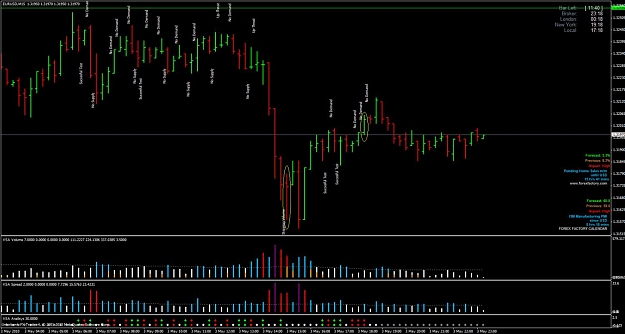
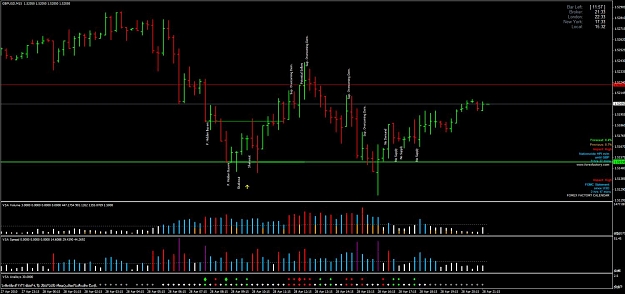
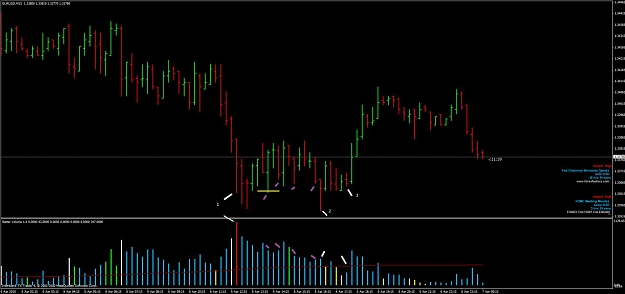
This was my trade from today. I saw some stopping volume followed by what looked like a shakeout (first yellow ellipse). So went long at 1.3773 and set my usual 30 pip stop and a 30 pip TP which was hit on the bar inside the second yellow ellipse. ...
Trade Using VSA (Volume Spread Analysis)
- Tataocb replied Apr 29, 2010
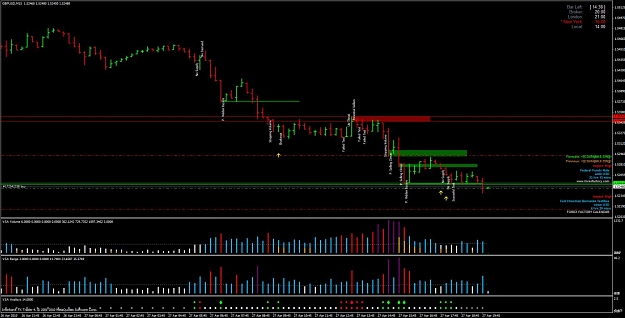
Came home from my marvelous - job answering calls from angry people who did not get their money back - at the Call Center and found this setup. I saw some stopping volume and a big shake out followed by some low vol tests and no supply bars and ...
Trade Using VSA (Volume Spread Analysis)
- Tataocb replied Apr 28, 2010
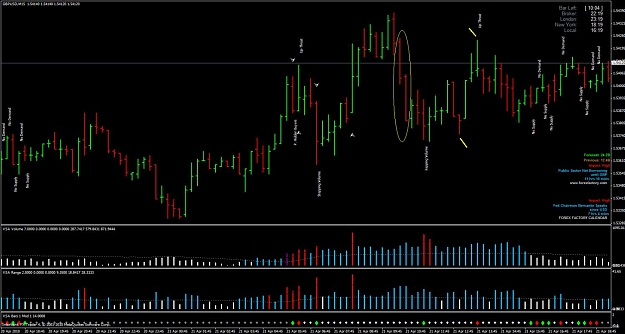
This is another trade I took today. Saw weakness building up in the background with supply overcoming demand and potential hidden sellers so went short on the high vol. candle that closed in the middle. I set my SL above the previous high at 1.5450 ...
Trade Using VSA (Volume Spread Analysis)
- Tataocb replied Apr 27, 2010
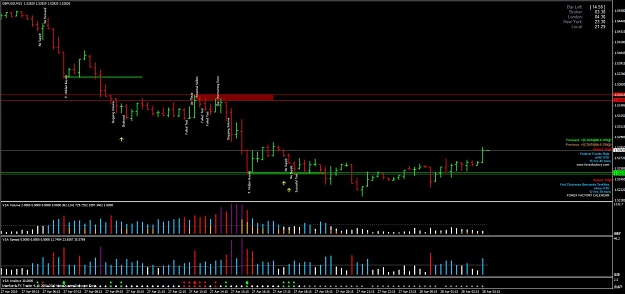
Hi guys, I just want to share this trade I just recently got out of. When I entered I noticed a wide spread downbar followed by no supply and a low vol test. I was waiting for a shakeout and then went long. The problem is, since it was around 4 pm ...
Trade Using VSA (Volume Spread Analysis)
- Tataocb replied Apr 21, 2010
Hey, let me share my analisis this morning on a succesful trade (it was only 25 pips, but then again, it's better than losing). The circled bars on the 30 min chart formed a high volume wide-spread downbar (potential hidden buyers); so I went to the ...
Trade Using VSA (Volume Spread Analysis)
- Tataocb replied Apr 6, 2010
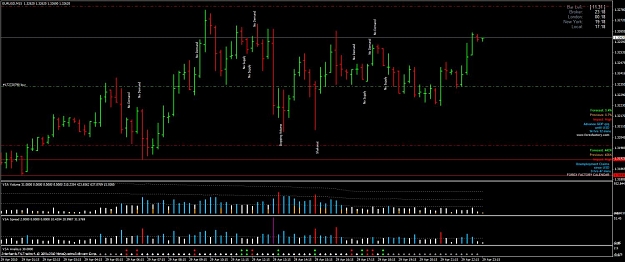
how was my VSA reading? — A question for you VSA knowledgeable guys. I've been studying VSA and took this trade today and would like to get some feedback as to if I was reading the chart correctly in terms of VSA or if I was way off. The chart ...
Trade Using VSA (Volume Spread Analysis)
- Tataocb replied Mar 8, 2010
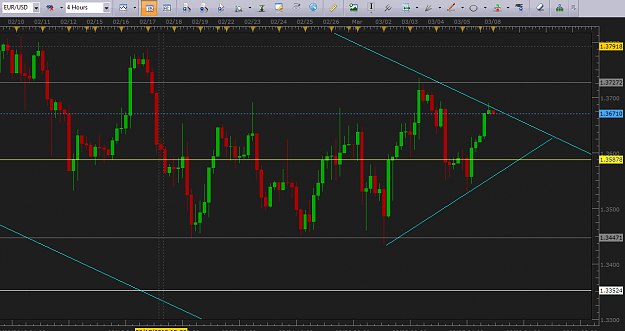
cant decide — I cant decide wether to short here down to 1.3625 or possibly 1.3590 or wait to see how this triangle unfolds. Weekly seems to be forming somewhat of a rounded bottom which makes me think the downward channel coulb be broken ...
EURUSD
- Tataocb replied Jan 7, 2010
Well, I was off by 10 pips, but still I took the trade
USD/JPY Discussion . Now Im thinking maybe a retrace back to the 92.50/75 area. UJ is climbing and volume is decreasing, so I dont think it will go much higher before coming down a bit or at least ranging for a ...
- Tataocb replied Jan 6, 2010
Yesterday I did not enter on the touch of the trendline cause I had not drawn the S/R lines. Now I kinda wish I had, lol. So now Im waiting to see if it touches the trendline again to go long or maybe at least go down to 92.00 before going long. ...
USD/JPY Discussion
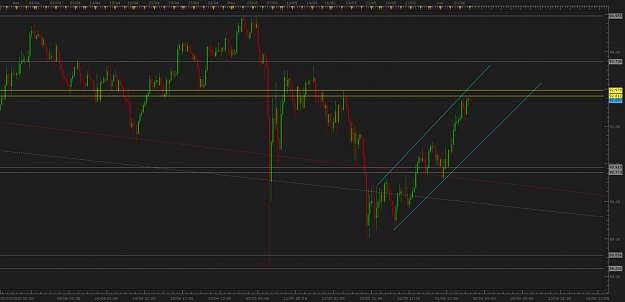
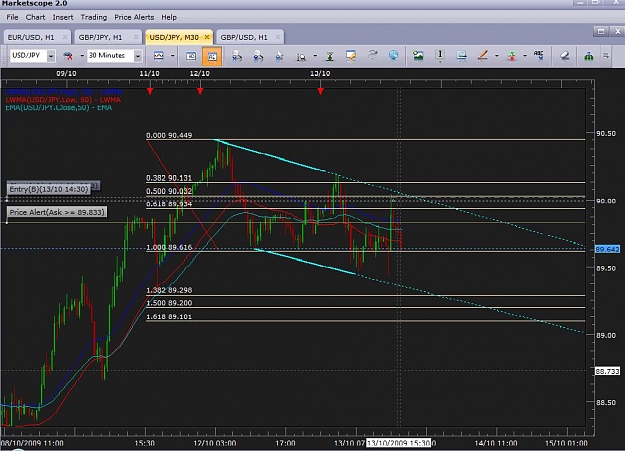
- Tataocb replied Oct 13, 2009
My outlook — This is what Im seeing. We have 2 channels on daily chart, a huge one and a smaller one within the huge one. Everything seems to point that we should go up to around 93 before another nice fall. But until we get there Im trading ...
USD/JPY Discussion
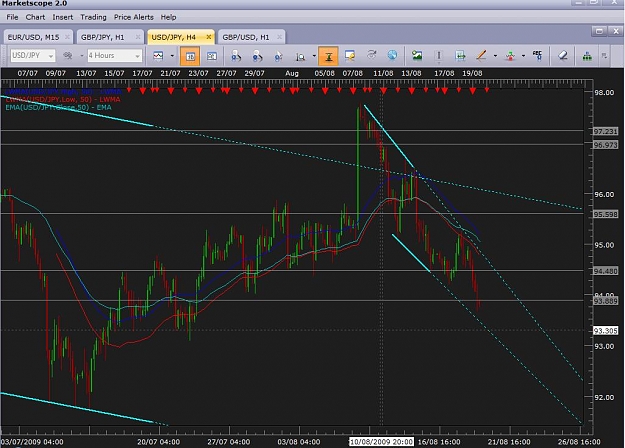
- Tataocb replied Aug 19, 2009
I'd wait for a price to go up to the 94.40/50 area, wait for a reversal and short from there. My last trade was a short from 95.04 after the reversal at 95.28 and took profit at 94.15. So that's my plan for now. I dont like to trade against the ...
USD/JPY Discussion
- Tataocb replied Aug 3, 2009
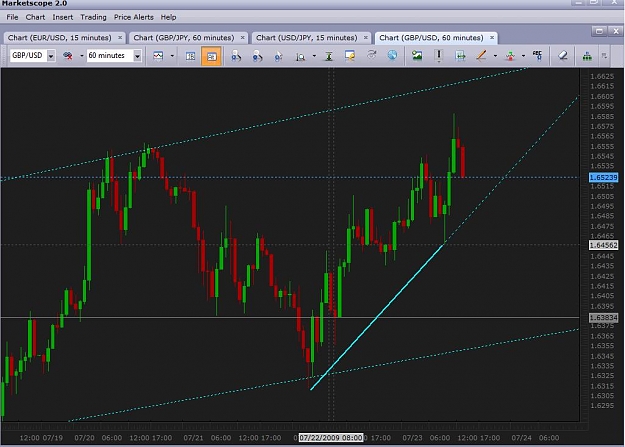
Divergence? — I've come here to get opinions from the RSI experts...a divergence seems to be forming on GU in the 15/30/60 min timeframes, but not on 4H. Do you guys think this divergence will play out? GU just seems to be climbing, climbing ...
Auslanco - GBP/JPY and GBP/USD (newstrade)
- Tataocb replied Jul 23, 2009
I know what you mean dude. The Beast can be frustrating to trade. But GU has to break the trendline before it can go down to perhaps 1.64 and if you take a look at UJ it just keeps going up, consolidates a while, then up again. Im just staying out ...
Auslanco - GBP/JPY and GBP/USD (newstrade)
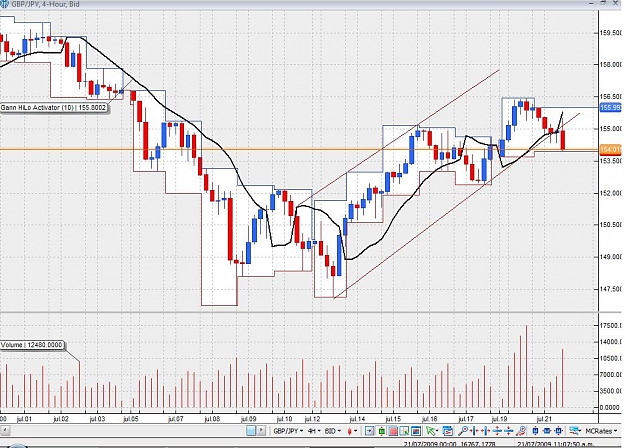
- Tataocb replied Jul 21, 2009
I was looking at the 4H chart and selected the Volume Indicator on a VT Trader demo account which I sometimes use for analysis (my real account is on FXCM Micro, which has very limited and basic Indicators). But it caught my attention how high the ...
Auslanco - GBP/JPY and GBP/USD (newstrade)
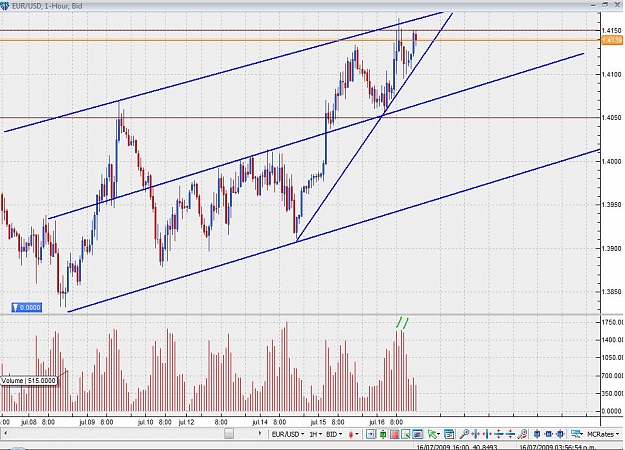
- Tataocb replied Jul 16, 2009
There seems to be high volume on the High price and low volume on the climb back up. So I would think it might get up there again or maybe 1.4150 is as high as it's going to go. You can see a clear trendline as well. Maybe once it breaks it will ...
EURUSD