- Search Crypto Craft
- 6 Results
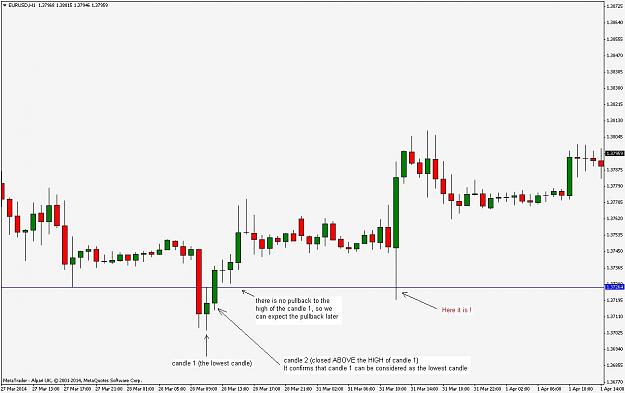
- Rodrigo replied Apr 1, 2014
Hi Calculus, This chart is very good example but I'm not so surprised that price on EUR/USD, March 31 got as low as 1.3720. I would have expected it at 1.3726 (at least). Let me explain. I observed an interesting thing which I've been playing with ...
Building an equity millipede
- Rodrigo replied Jun 1, 2011
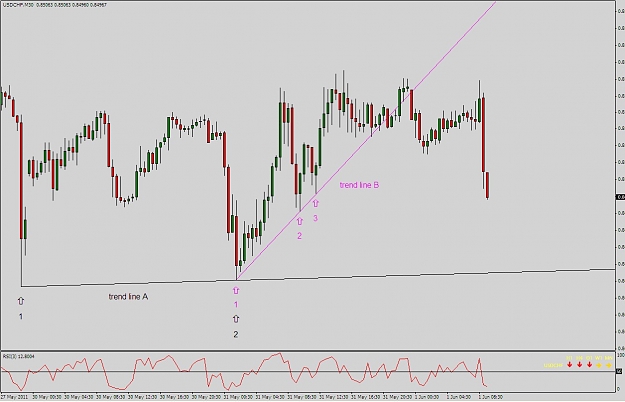
usd/chf — Hi Snowman, Sorry about the chart, here it is again. My understanding of the 3 tap is that if the price makes a higher low (after a down move) we can draw a trend line which connect these 2 points. I learned that: "Highs are defined ...
Trade What You See - Almost Naked Trading
- Rodrigo replied May 31, 2011
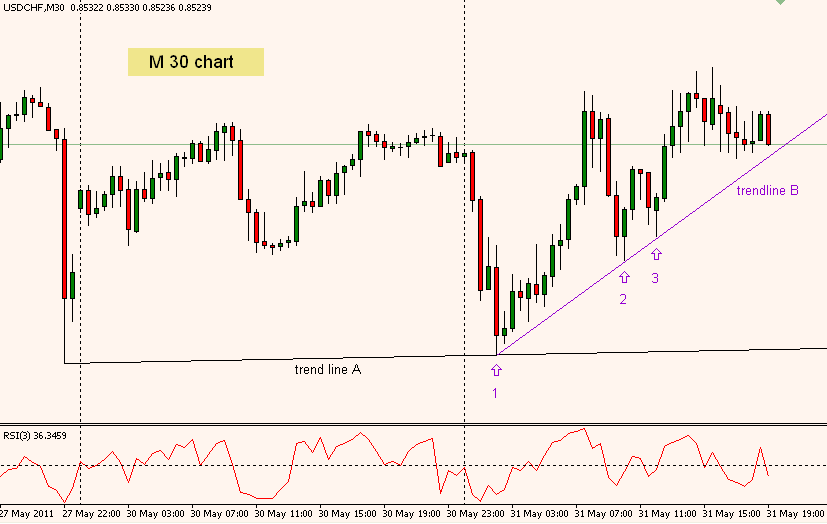
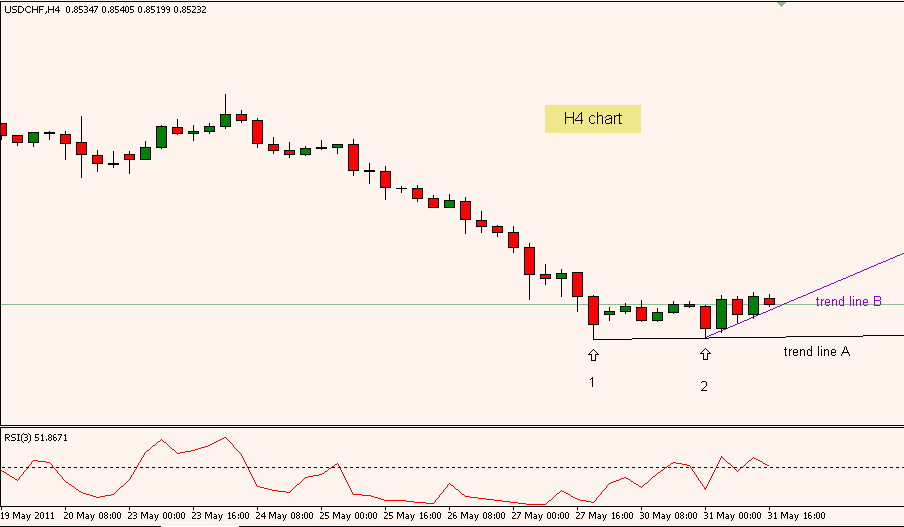
Well, it looks like 3 tap on lower time frame charts to me (see M 30 chart, points 1, 2 and 3 on trend line B). So far I can see only two points on H4 chart (trend line A (black) on H4 chart). This is how I understand it.
Trade What You See - Almost Naked Trading
- Rodrigo replied May 31, 2011
? — Why is this a H4 3 tap? I don't understand
Trade What You See - Almost Naked Trading .
.
- Rodrigo replied Mar 31, 2011
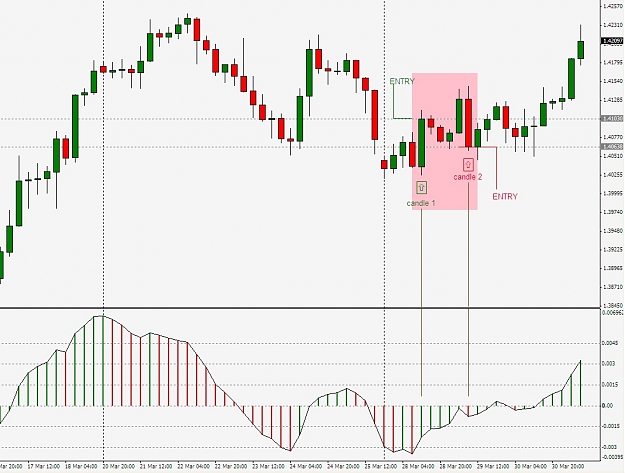
two signals — Hi guys, Please help me explain following situation (in the pink box). There is a buy signal - candle 1 (at 1.4103). Let's say you haven't taken your profit yet and in the mean time you get the opposite signal - candle 2 (at ...
4 Hour Strategy (MACD)
- Posts by Member Search: 'Rodrigo'