- Search Crypto Craft
- 54 Results (1 Thread , 53 Replies )
- Plata replied Feb 15, 2011
Lots of body hair: image Aha - German fetish, here you have the proof: url
vsa with Malcolm

- Plata replied Feb 15, 2011
Sounds like you like it
vsa with Malcolm Can you please explain how this baby works? image
- Plata replied Feb 15, 2011
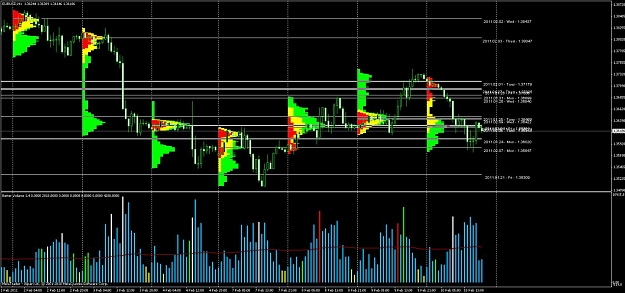
Thank you Bandung and Fudomyo for sharing the indis! What is the difference between the two? Today, price reversed at the Virgin's yesterday's POC, but AY's yesterday's POC is situated higher... Can the VirginMP indi show today's profile, too? Thank ...
Auction Market Theory and Market Profile
- Plata replied Feb 10, 2011
Thank you much! OK, this hype about market profile has got me, too
vsa with Malcolm I got the tool and I'm reading "Markets in profile", I'm at page 60 or so, but I did not get much of it, yet. So around the POCs are balance areas - Its like one can see them by ...
- Plata replied Feb 10, 2011
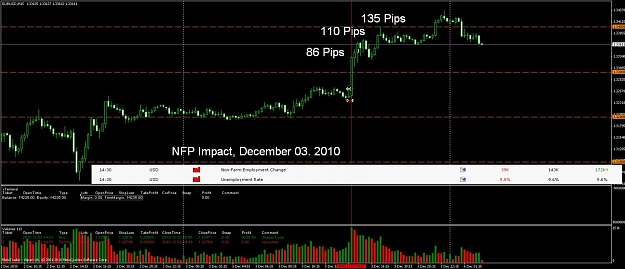
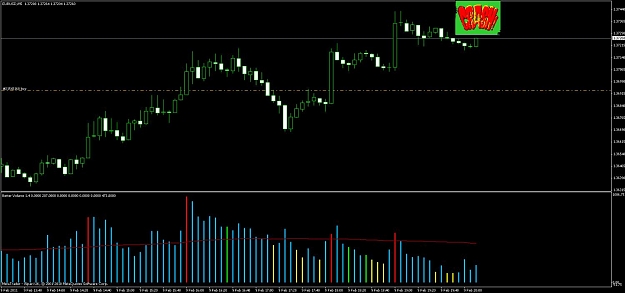
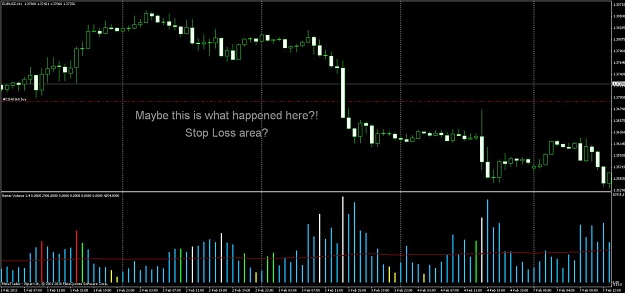
Bulish / Bearish enviromet? — Last time I tried to catch the knife, I got hurt. Price was marked down pre NFP. There was stopping volume, a retrace but further downward move on lower volume. As it was late in the session, I speculated that ...
vsa with Malcolm
- Plata replied Feb 9, 2011
POW — OK, my assumption "late in the session" had been proven wrong! Nice advice Dr.
vsa with Malcolm How will you treat your 1.3680 position? Possibility is let it run until one sees shortening of thrust or signs that seem like end of rally is ...
- Plata replied Feb 9, 2011
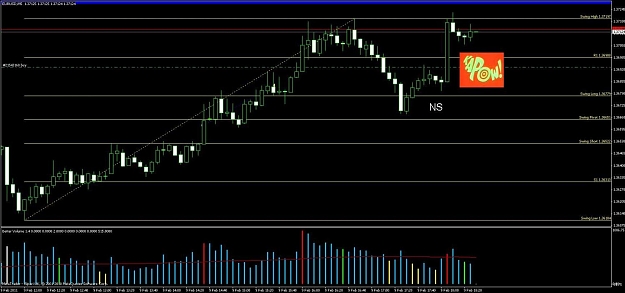
But it looks quite healthy, no?! Retrace on lowering volume to 38 - 50 % Fib, NS and POW!!!! image
vsa with Malcolm
- Plata replied Jan 31, 2011
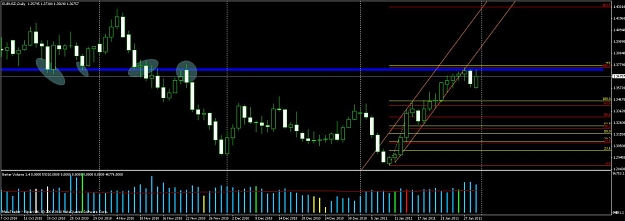
Loosing steam — - Price made less progress during the last days (shortening of thrust) - failed to reach the 155 Fib on the daily chart (yellow) - price has difficulties to penetrate resistance (blue) - trend line did not hold => Trendchange? ...
vsa with Malcolm
- Plata replied Jan 27, 2011
I'd say absorption, too. This is the 61.8 fibonacci level on the daily chart. On the other hand price retraced there in november. A close above this level is significant
vsa with Malcolm image
image
- Plata replied Jan 27, 2011
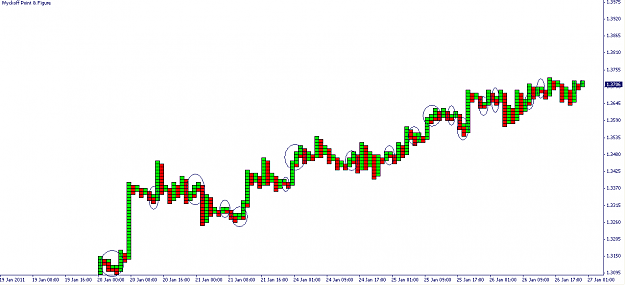
Hi Seboh! Nice 1-box-reversal chart
vsa with Malcolm image Would you mind posting your indi? I got this one which eats my computer's cpu: url
- Plata replied Jan 26, 2011
Hey there! Point and figure charts can be used to determine how far movements are about to go. It is said that the longer price stands still around one level, the more far the next move will be. In my calculation (this is my first trial) the next ...
Intraday Point and Figure Trading
- Plata replied Jan 26, 2011
PnF — Hey there! Point and figure charts can be used to determine how far movements are about to go. Point and figure charts don't measure time, so the blocks don't align with the candle chart. The cup like formation on the left (not seen in ...
vsa with Malcolm

- Plata replied Jan 17, 2011
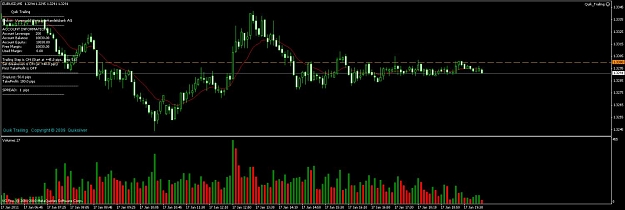
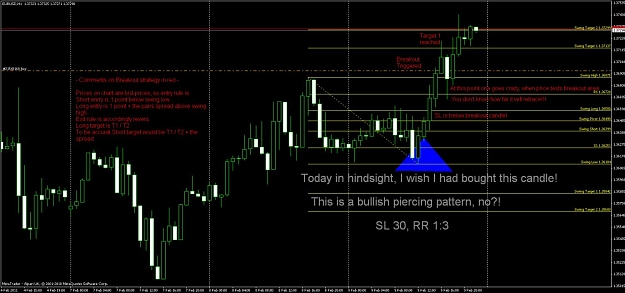
Varengold Wertpapierhandelsbank — Hello there! Could someone please take a look at the 5 min chart of this broker. I like the spikes in their volumes. Is this good? To me it looks good in hindsight! They have a 200:1 leverage and 1 pip spread ...
vsa with Malcolm