- Search Crypto Craft
- 70 Results (2 Threads, 68 Replies)
-
 NowAndLater replied Dec 26, 2010
I've read through this thread and it's evolving very fast, can't afford to miss a day with this action. Anyway, I have these thoughts: 1) How was the first open price chosen, since this first one is determining the outlook and look of the range bars ...
Dreamliners’ MPAS (Mechanical Price Action Strategy) System
- NowAndLater replied Mar 12, 2010
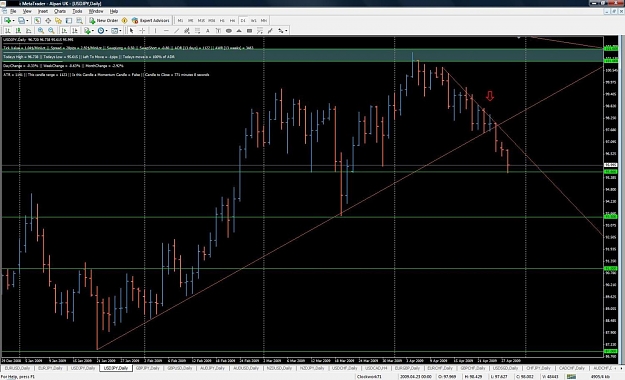
Not sure if ur trade got triggered yet, but if ur stoploss is the entire bar then u should have about a 55-60 pips stoploss (including spread, there or there about). There's a trendline acting as resistance plus a s/r at around 91.30 which should be ...
The DIBS Method... No Free Lunch continues
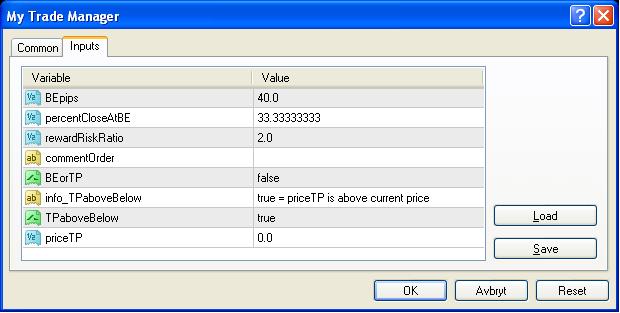
- Free Trade ManagerStarted Mar 6, 2010|Platform Tech|1 reply

Hi all! I'm posting my own trade manager that have helped me a lot, maybe it will be helpfull for ...
- NowAndLater replied Sep 22, 2009
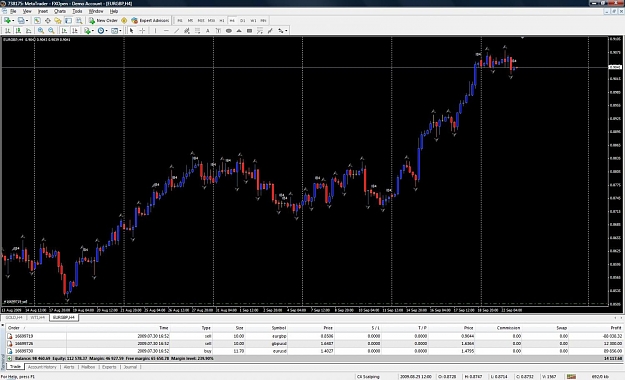
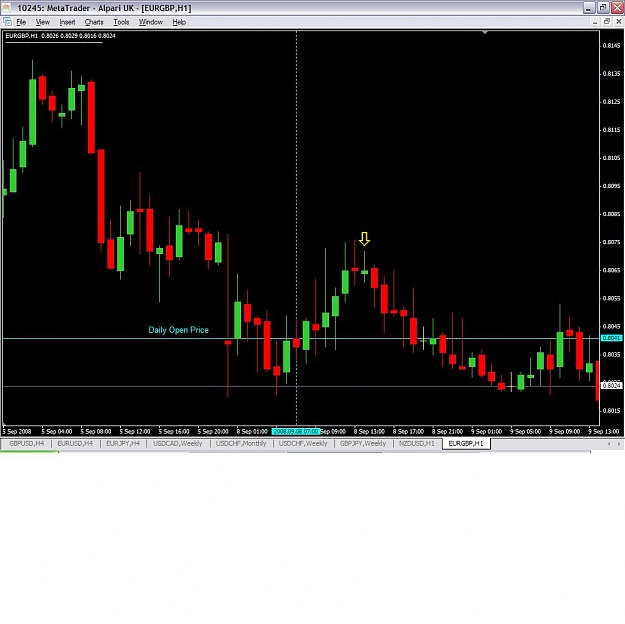
See the picture and the reason to why I was interested in the situation to begin with, same trade is now up a whole bunch of pips. And it seems to be the other way of the trade of EURGBP. As you can see I've originally sold EURGBP, but the trend on ...
Hedge Trading Indicator
- NowAndLater replied Aug 28, 2009
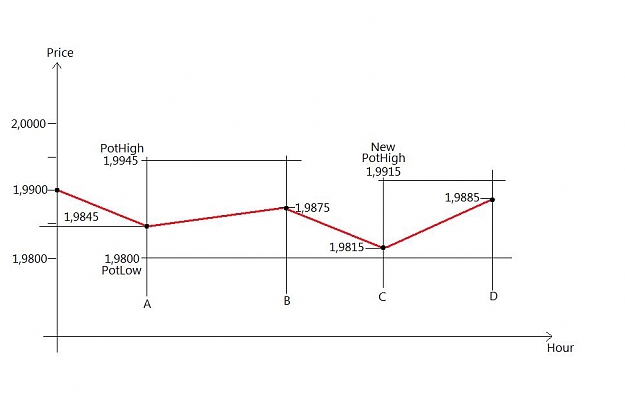
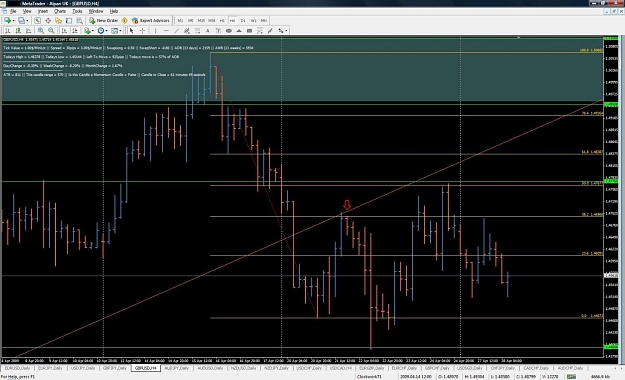
I hope this is what you mean. You need to calculate these: TodaysRange = HighToday - LowToday LeftToMove = AverageDailyRange - TodaysRange PotentialLow = LowToday - LeftToMove PotentialHigh = HighToday + LeftToMove PriceToLow = CurrentPrice - ...
Maths (ratio) problem
- Hedge Trading IndicatorStarted Aug 4, 2009|Platform Tech|10 replies
Greetings earthlings
 ! I would really appreciate if someone had the time to help me out and make ...
- NowAndLater replied May 25, 2009
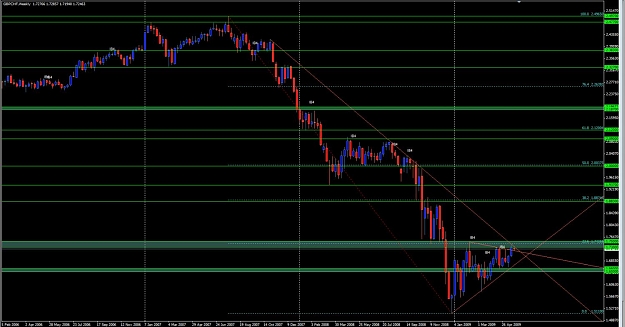
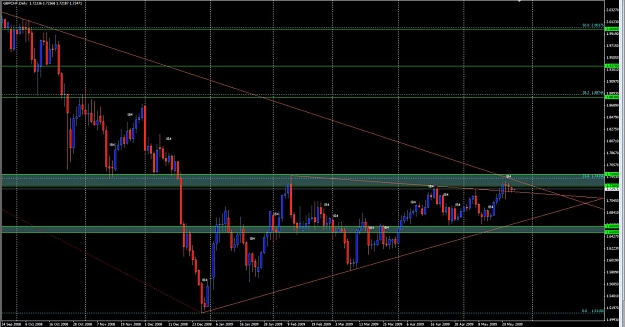
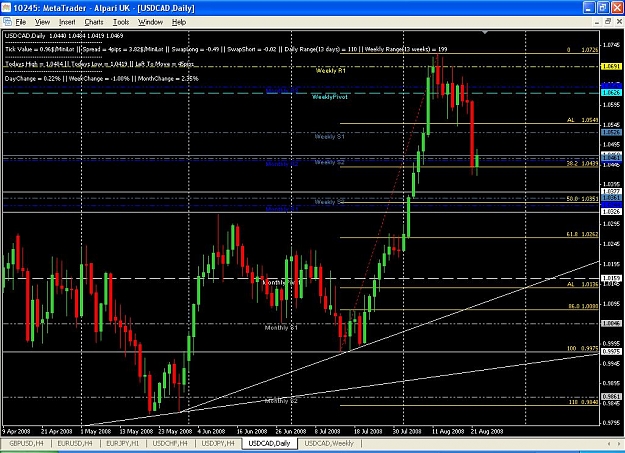
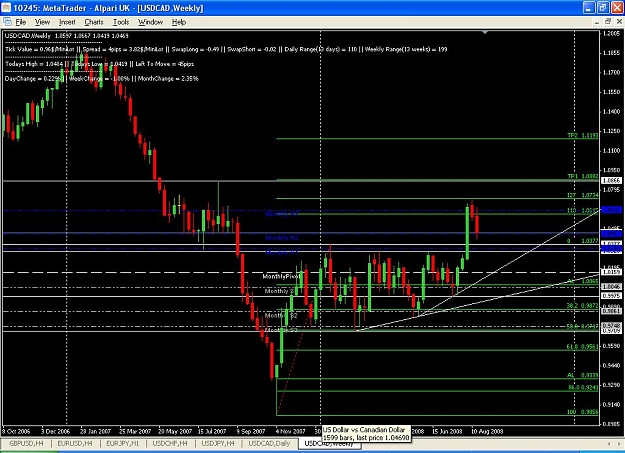
Yes been watching this one also. Theres also a big trendline close to where price is and dating back to november 2007. A break and retest of trendline and s/r area would be and ideal place for long. RR seems to be very good for the long by looking ...
Silent Service Method
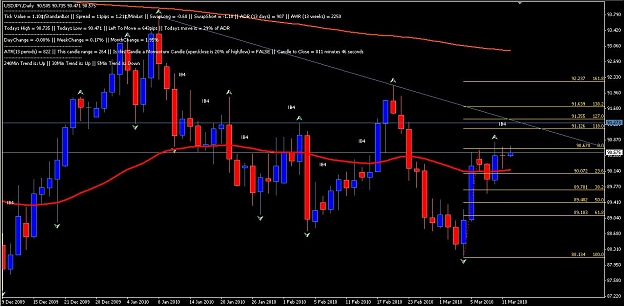
- NowAndLater replied Apr 28, 2009
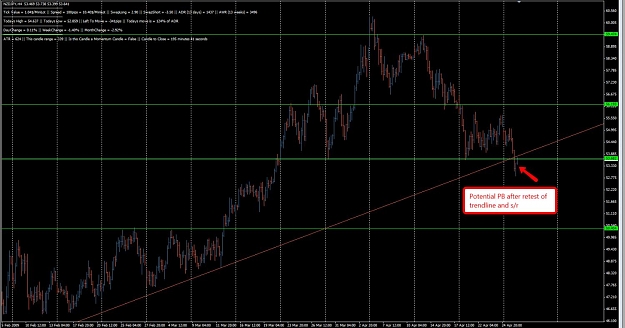
Potential trade setup NZDJPY — Setup as per chart. Bar closes around NY open so should be intersting, it could be a PB by then
Silent Service Method
- NowAndLater replied Apr 28, 2009
Absolutely great! — Hi CW, just finished reading the thread and I thank you so much for the time you have put in and the invaluable knowledge you have shared with us. I trade using PA, trendlines, s/r zones, and fibs, and it's similar to what ...
Silent Service Method
- NowAndLater replied Feb 3, 2009
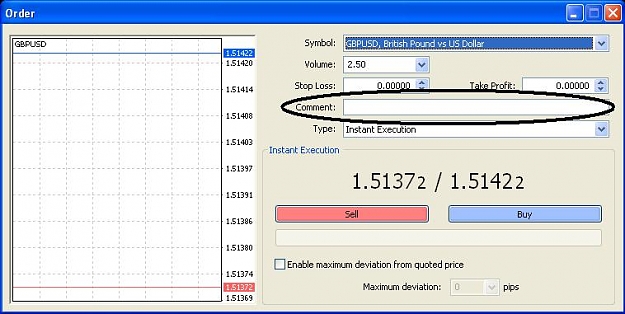
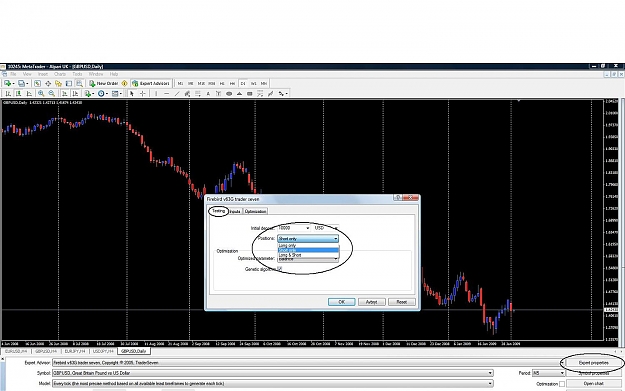
Hi madscalp I'm not really following this thread and I'm not sure if you've already tried this but it might help. If you press "Expert properties" in the bottom right in the picture and the press the tab "Testing" in the box, and then choose from ...
Semi automatic EA (Driven Version)
- NowAndLater replied Sep 9, 2008
Hi DIBS'ers! I haven't been able to be around the past weeks and this will be ongoing as I have shifted priorities (very positive though
The DIBS Method... No Free Lunch continues). Hope everyone has been good. I've tried to catch up on the thread and I will address this issue. @Fumiryu ...
- NowAndLater replied Aug 24, 2008
Yes it's a TMLTB - TwoMatchingLowTrendBreakout. Whenever the low is breached it's a valid short. But there's plenty of heavy support below. Look at the charts below. Watch the price reaction to this area and manage the trade accordingly.
james16 Chart Thread
- NowAndLater replied Aug 22, 2008
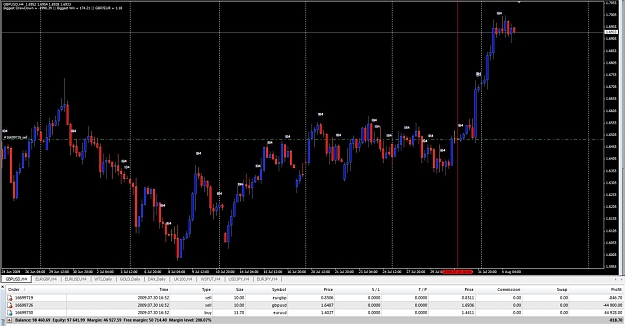
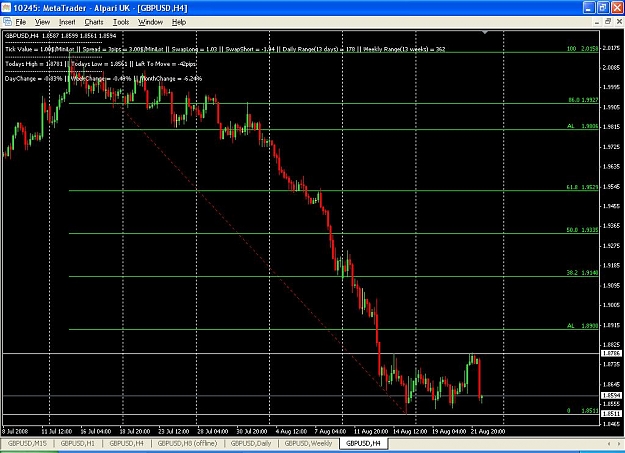
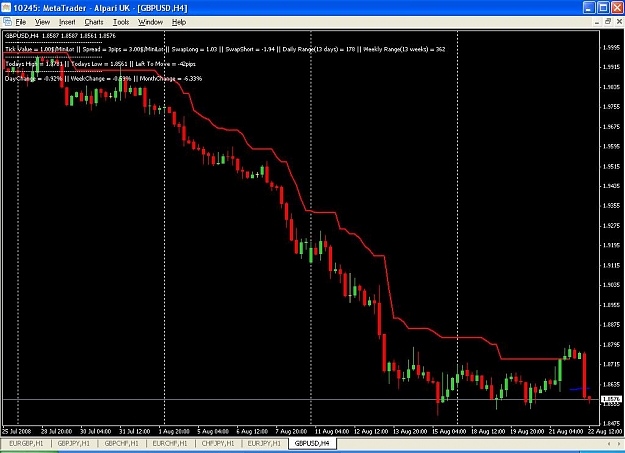
Yeah I agree here with you. For me GU is in a range as seen in the chart between the 2 white lines. Yesterday's high only just went above the high of 14/Aug, only to go down again about 200 pips, for me confirming the range. If price goes above 1.88 ...
The DIBS Method... No Free Lunch continues
- NowAndLater replied Aug 22, 2008
If you are looking to get into a long trend (like the one we had the past month when the USD was going all out attack) I think you need to be generous on the sl. By that I mean you want the sl to be 1.5->2*ADR (average daily range) away from where ...
The DIBS Method... No Free Lunch continues
- NowAndLater replied Aug 21, 2008
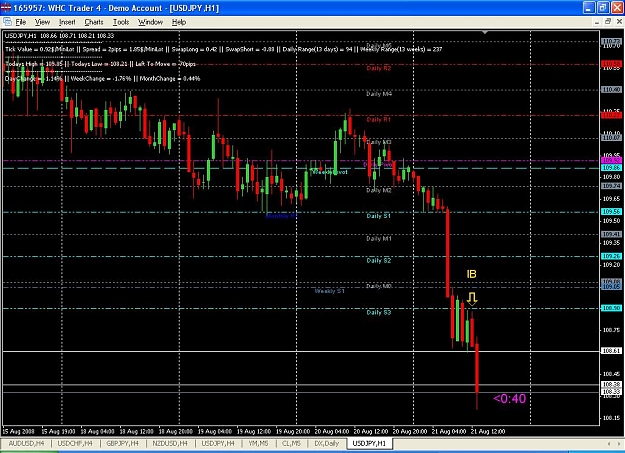
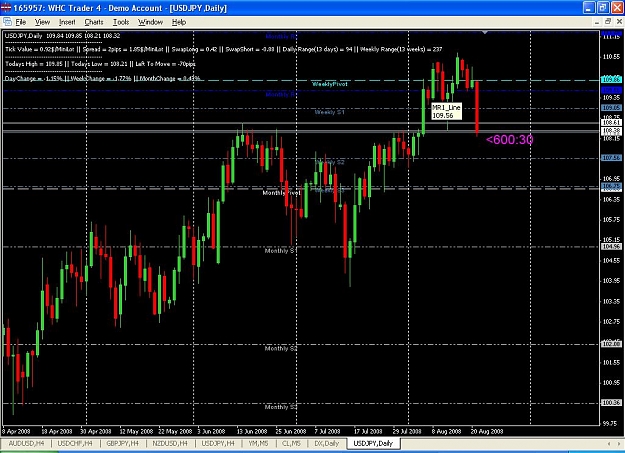
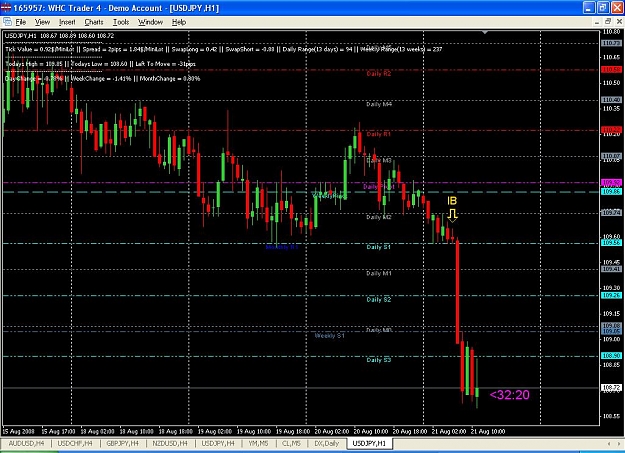
UJ add-on on another major support break. The IB came again on the s/r level, 108.61, and price action was very similar to the IB at the daily open, only difference was that the IB was a bigger one - now 24+2+3 = 29 pips. This s/r level is the high ...
The DIBS Method... No Free Lunch continues
- NowAndLater replied Aug 21, 2008
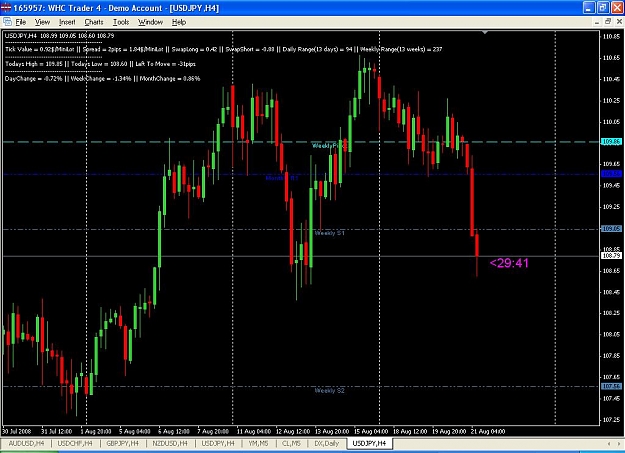
As good as a DIBS trade will ever be — This is for me when DIBS works best: when price is testing a s/r level and you get an IB just off the daily open and it's off the s/r level. Looking at the H4 chart you can see how this level has been ...
The DIBS Method... No Free Lunch continues
- NowAndLater replied Aug 11, 2008
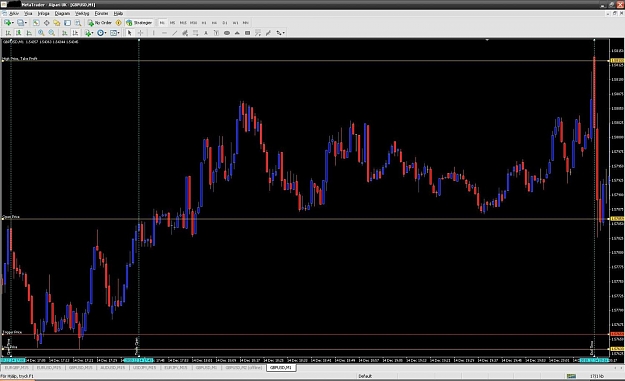
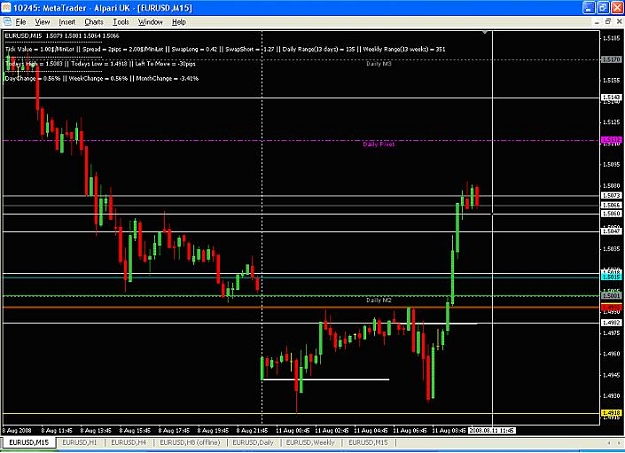
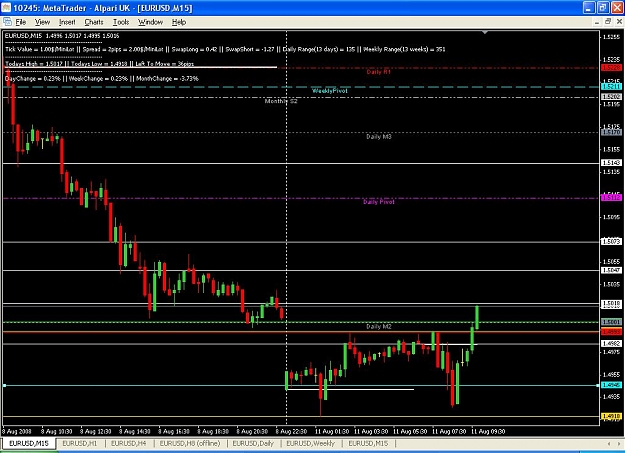
I like to trade with the trend as much as possible, but sometimes like the example you can take a countertrend move for a small profit when the setup is supported by other things (as the 1.5000-level). The trend is cleraly down and I actually closed ...
Breakout Confirmation? ideas
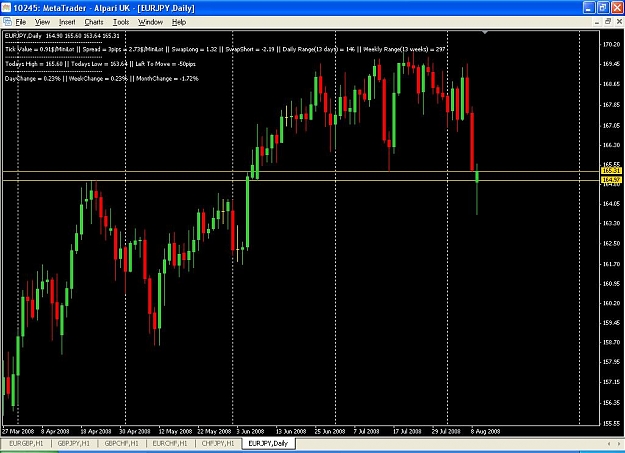
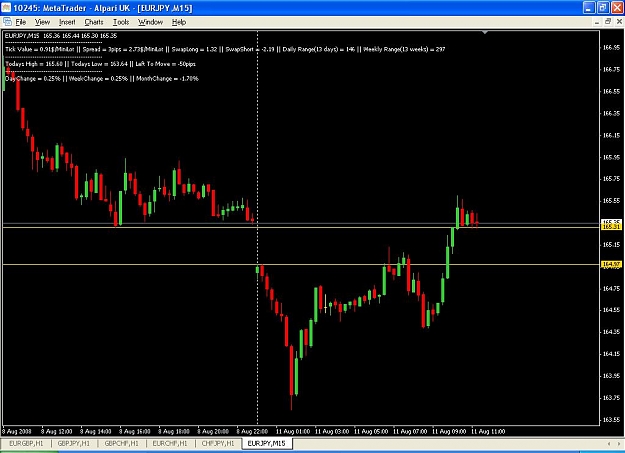
- NowAndLater replied Aug 11, 2008
Looking at the daily for confirmation the trade will get you in above 165.31 which was a support eariler. Looking at the M15 chart this support seems to be holding so it's a good trade up if it breaks up and the support holds imo
The DIBS Method... No Free Lunch continues
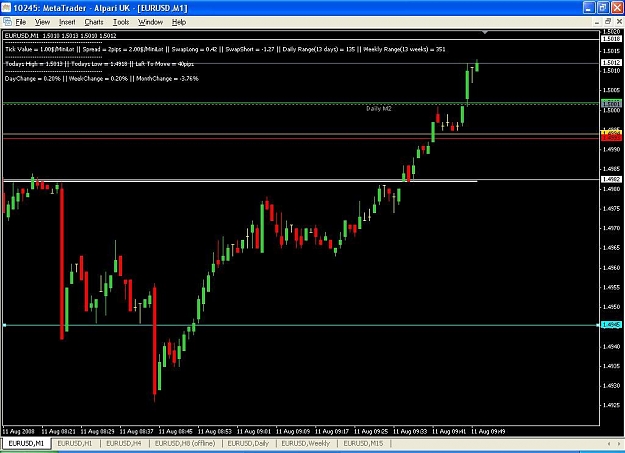
- NowAndLater replied Aug 11, 2008
First of all look at where price is at the moment. Price went below 1.5000 but stopped and is now reversing giving the overnight range shown between the two solid yellow lines on M15 chart. That is a great range since the resistance of the range is ...
Breakout Confirmation? ideas
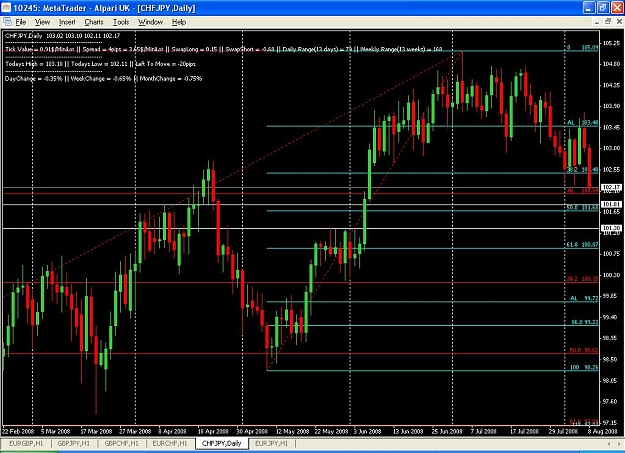
- NowAndLater replied Aug 8, 2008
Just gave it a quick look (don't trade this pair) and here's what I see: Blue 50% fib area around 101.65-101.80, and then 101.30
No Brainer Trades