- Search Crypto Craft
- 13 Results
- MrGray replied Apr 21, 2016
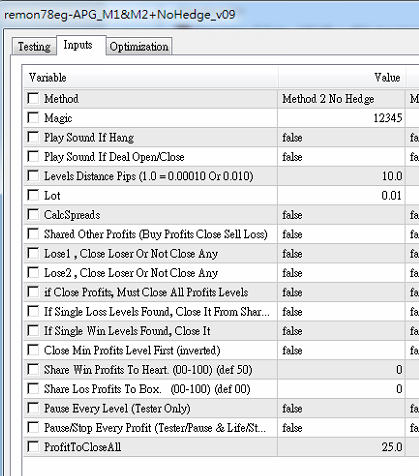
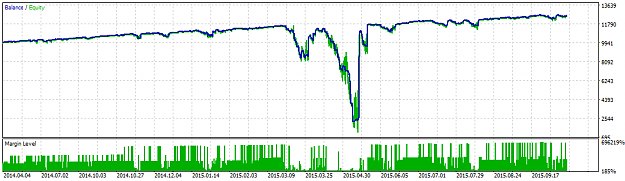
Start crashing from 2014/08 M1 Period , Setting is below
Accumulative Profits Grid System
- MrGray replied Apr 21, 2016
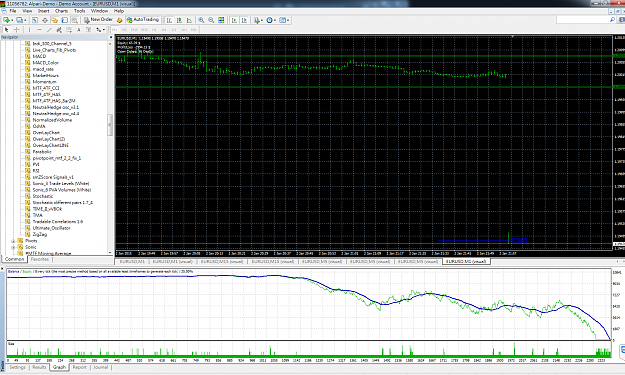
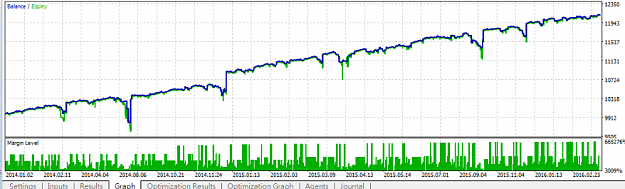
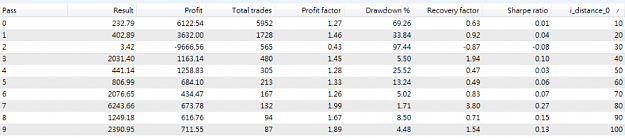
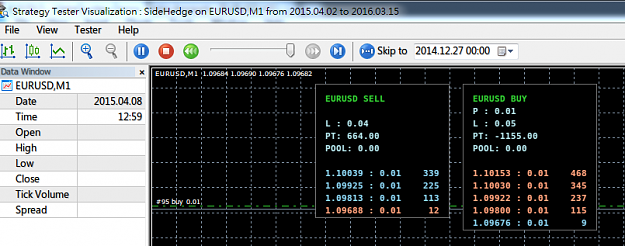
Still same as simulator's result... it crash when long and huge trend. We have to think how to cover lose trade if trend is getting bigger. You can try 2014/06 - 2015/03 EURUSD
Accumulative Profits Grid System
- MrGray replied Apr 15, 2016
Sorry... first, please forigve me my poor english. You standing on wrong view to look this things. He dont have to reply any question about his method. He is just one person, and a lot question out there. He think his point is right. Because he ...
Accumulative Profits Grid System
- MrGray replied Apr 13, 2016
Sorry, I'm still working on it. It pass 2014 bad time...but it faill when huge down then huge up...and lot small wave...
Accumulative Profits Grid System
- MrGray replied Apr 13, 2016
But if it's not big enough... usually .it always like this "up down up up down down up up up up down"... then method2 will open lot sell trade and it hard to recover after trend back to normal up and down... bottom sell wont have chance to close. by ...
Accumulative Profits Grid System
- MrGray replied Mar 27, 2016
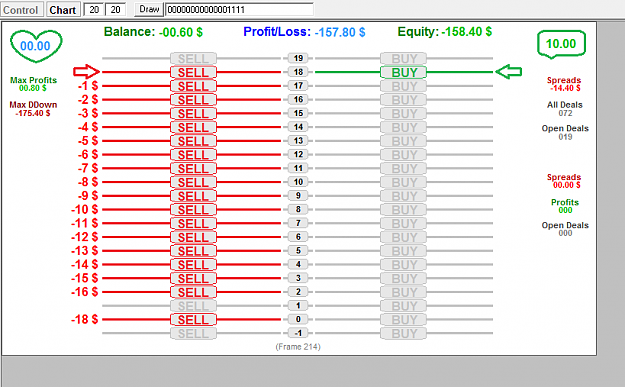
You can try to use this url make a virtual trader for you self on screen image
Accumulative Profits Grid System
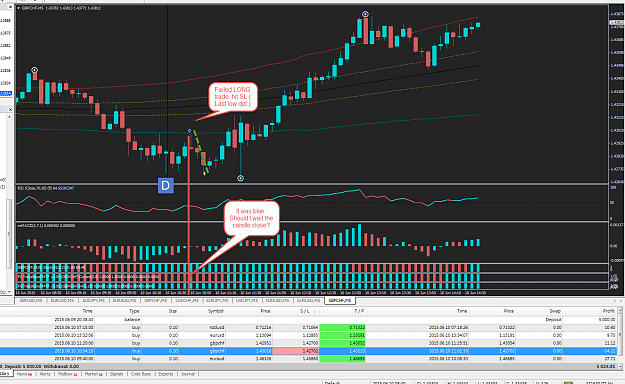
- MrGray replied Mar 10, 2016
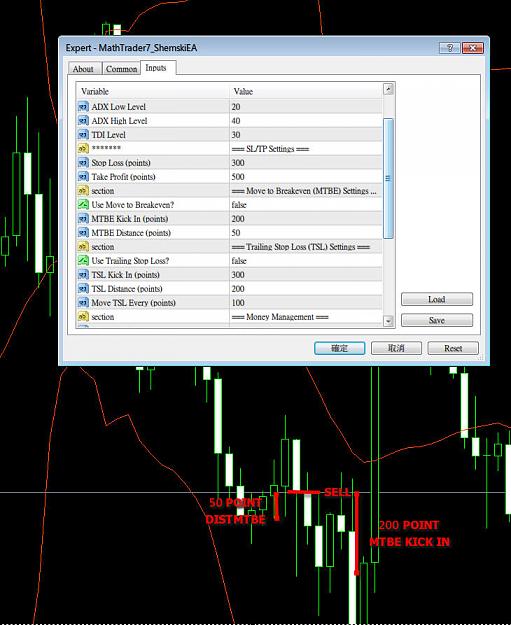
Hello MathTrader7. May I ask some stupid question about ea setting? ( please forgive me about bad english ) I want to know about more detail about "Move to Breakeven" and "Trailing Stop Loss".. Like image below, for example: if ea open a short ( ...
TDI-ADX System (swing trading using TDI)
- MrGray replied Jun 13, 2015
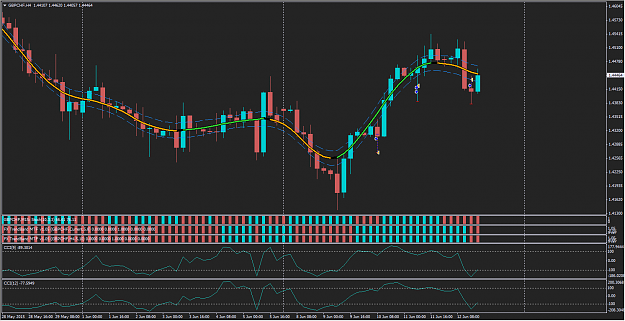
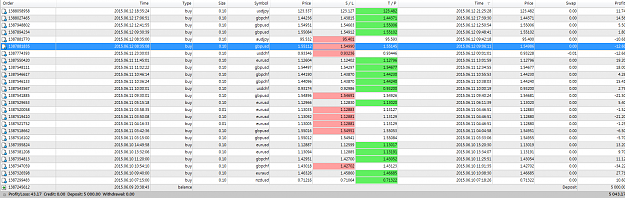
Me too! TMA is always my favorites indicator Another H4 chart After I analye all my trade. I found If I follow DTDT HTF (RIPT ) rule in H4. It work and make sense. If you look picture below, All trade were putted after big down trend. ( I didnt ...
Come Surfing Fx With Me System
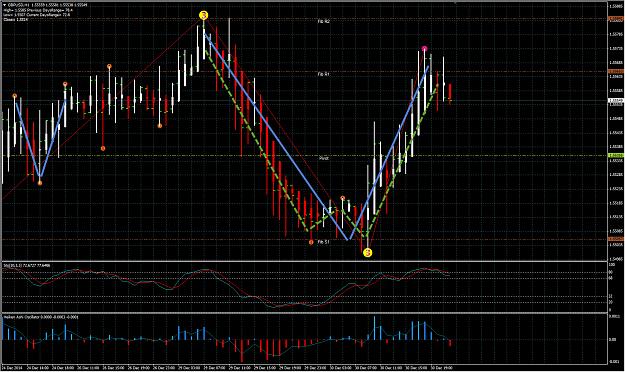
- MrGray replied Jun 13, 2015
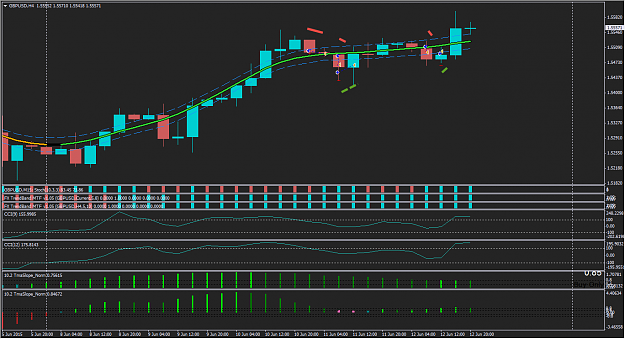
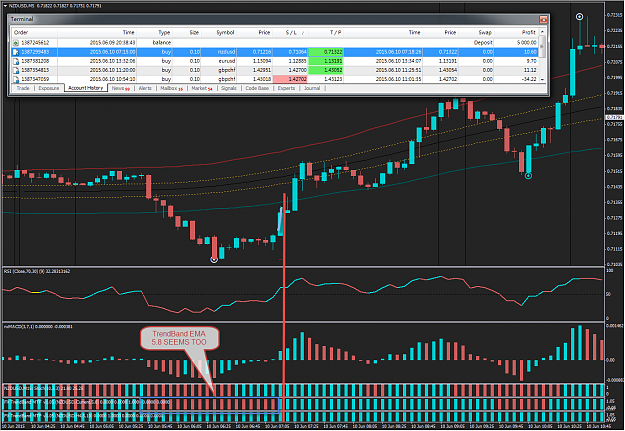
Here it's mtf tma slope modifed by myself. But I really dont recommand it ..slope is lag indicator. And I really like the idea "wait dot appear in HTF". I analyze my trade last week. I found something interesting. Below chart it's H4 ...blue dot ...
Come Surfing Fx With Me System
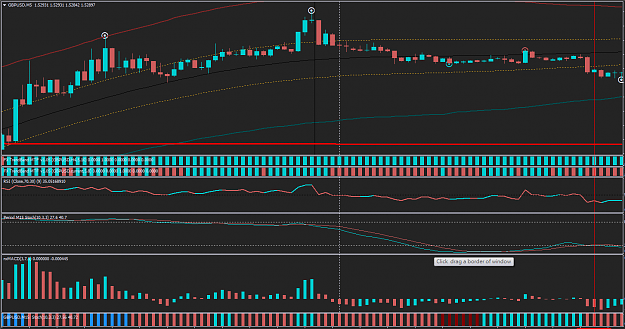
- MrGray replied Jun 10, 2015
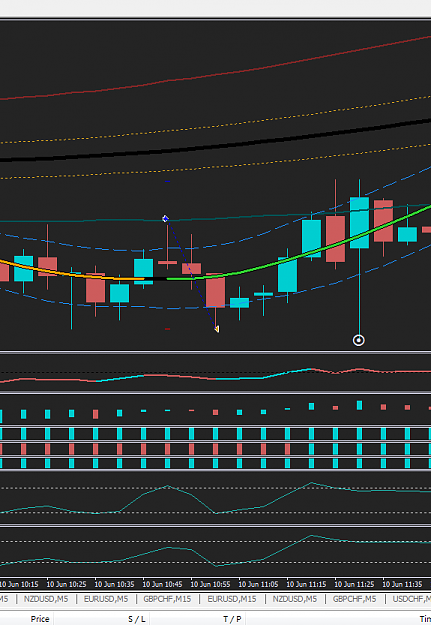
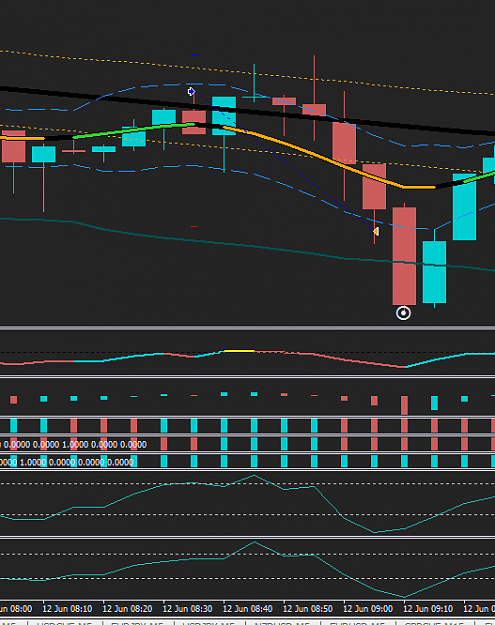
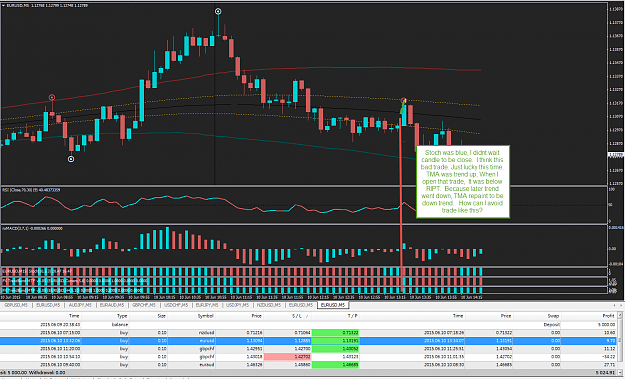
Share trade today DTDT_HTF NZDUSD M5 TRENDBAND EMA 5,8 seems too slow. Same as STOCH(M15), Sometime DOT appear and price is below RIPT, then trend keep go up, until enter RIPT channel, then finally It changed color after it already enter the middle ...
Come Surfing Fx With Me System
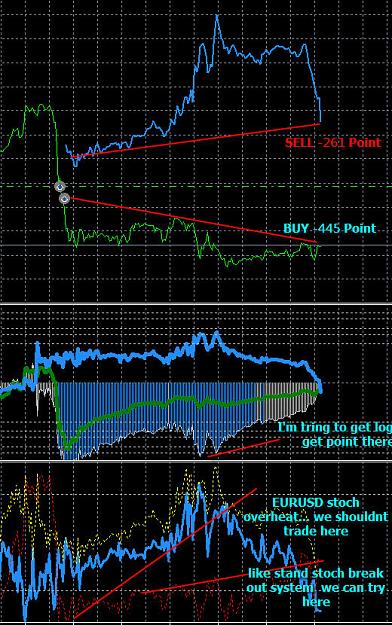
- MrGray replied Jun 9, 2015
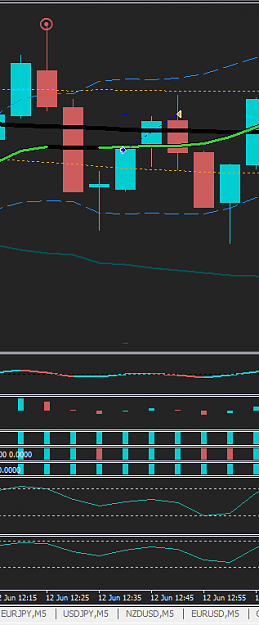
stoch(M15) MTF I did modify this indicator to be HISTOGRAM indicator like others , min 0, max 1. Since I guess we only need the signal that shown cross up or cross down. I also add two more color that shown over buy or over sell ( color6 and color7 ...
Come Surfing Fx With Me System
- MrGray replied Dec 30, 2014
Sorry, I have a stupid question. I did search about "Failed At Pivot". I still cant really the point about it. Is it means "When price try to break "pivot line" but failed. I think I understand it. But How long means it failed? If price cross pivot ...
Price Action Trading with Indicators! The Freebie System
- MrGray replied Dec 29, 2014
Sorry I'm not good at speaking english. First time post here !! Thanks for sharing this great system. Specially thanks to SwingMan for sharing his souce code.. So I can deep analyzing this. Also thanks Pierre and others to share their trade idea. ...
Hedge and Correlation Strategy
- Posts by Member Search: 'MrGray'