- Search Crypto Craft
- 18 Results (1 Threads, 17 Replies)
-
 Marrethiel replied Jul 24, 2009
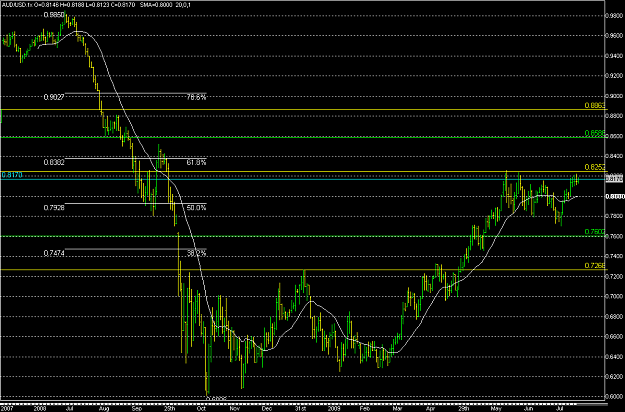
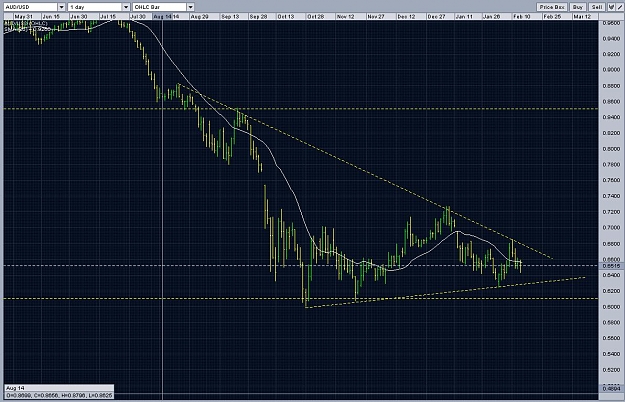
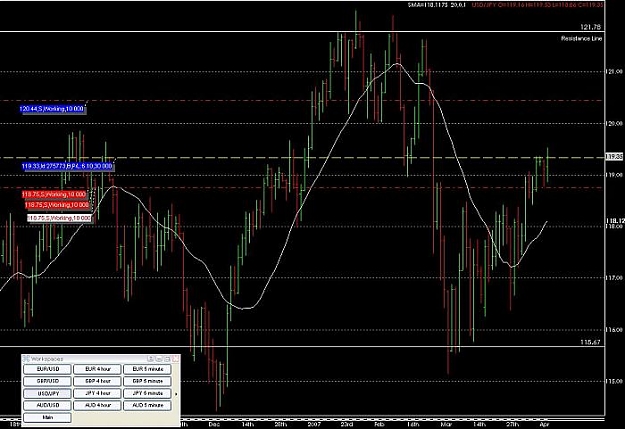
Fib numbers — Hi, I know most people like Fib Ratios, but have a look at these Fib Numbers for possible resistance/support. The yellow lines are the resistance areas short from the high of 9850, the green lines are long from the 6006 low. All ...
AUD/USD
- Marrethiel replied Jun 30, 2009
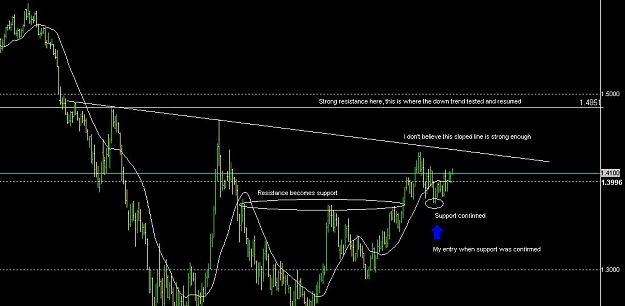
daily chart — For a longer term view, my TP is at 1.48 Still I'll jump out earlier if I see a reversal. EDIT: Interestingly, 1.4912 is the fib target (plus 2,548 pips from the 1.2328 low)
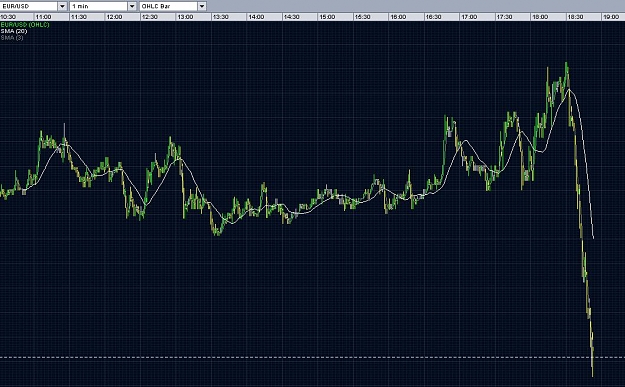
EURUSD were do we go from here ?
- Marrethiel replied May 11, 2009
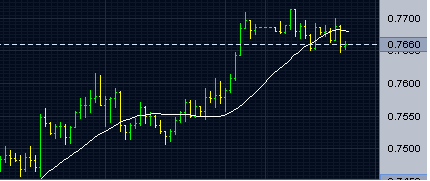
7519 which is the close of the low bar, I will be putting my stop on this trade around here once I take profit.
AUD/USD
- Marrethiel replied Feb 24, 2009
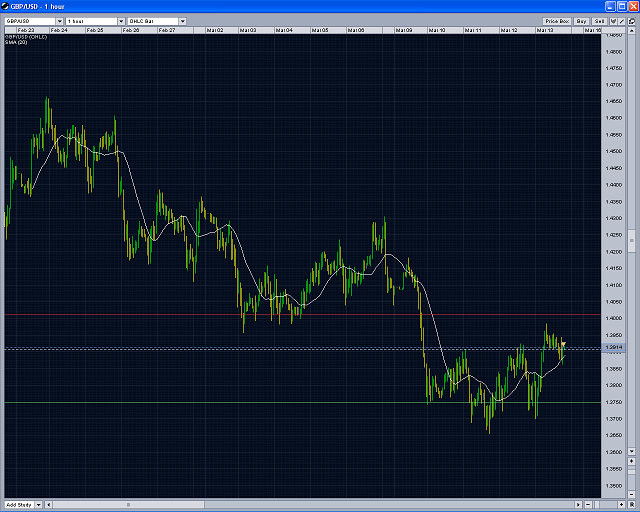
I see a tightening in the next day or so and am waiting for the break out. It's interesting that most of the time the pair has been over the centre of the wedge. This could be an indication of nothing particular. If it breaks short, then I will wait ...
Aussie Pairs

- Marrethiel replied Feb 20, 2009
To trade a currency pair you would need somone to take your trade, who would put money on the ZD getting stronger?!!??
Any brokers offering ZWD currency? (zimbabwe)

- Marrethiel replied Feb 12, 2009
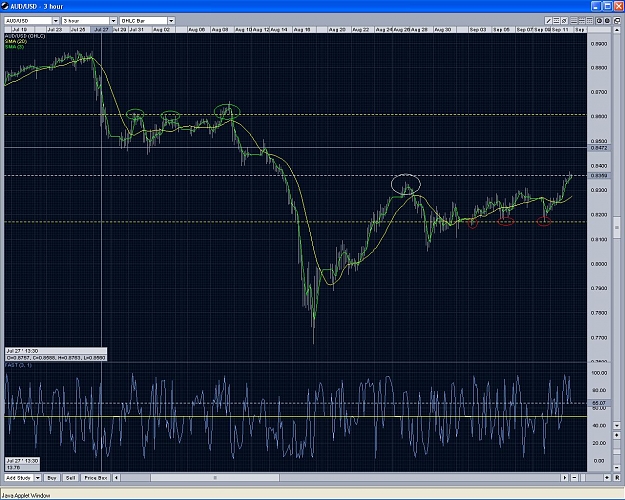
I am only taking very short trades (30 pips or so) in this ranging market. The stronger resistance seems to be on the short side, although the long term trend is obviously short. A 20 SMA is the only indicator I use atm, and it's more of a guide ...
AUD/USD
- Marrethiel replied Aug 12, 2008
I'm calling 0.8672 as my long entry point... Though the Aussie may actually be changing long term trend, I think this is a good spot to go long with a small trade. I'm going to put 0.8680 as a take profit for all my shorts.
AUD/USD

- Marrethiel replied Jul 4, 2008
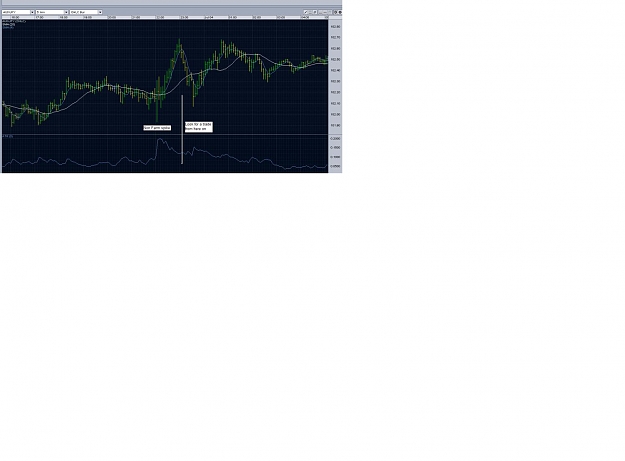
What I do, on the rare occasions I trade near a news release: Firstly, I wait for the spread to get back to normal as I use a broker that can vary the spreads. Second, I set an ATR (averave true rang) of 3 periods. I then look for this to get back ...
Hi...best time to place order after news released
- Marrethiel replied Sep 12, 2007
The day closed at 0.8349, so I added my spread of 2 pips and then rounded up to the nearest 10. I wanted the price to decisively clear the previous days high because I believe this will mean it has enough momentum to keep moving. Occasionally a bar ...
Aussie Pairs
- Marrethiel replied Sep 11, 2007
My newb understanding — In my view there are two things to consider. The first is that resistance isn't a specific point but rather a zone. The price had gone past the close of 16 August (on my chart) of 112.94 which I had as resistance. ...
Hidden Technical on Usd/Jpy

- Marrethiel replied Sep 11, 2007
I don't know, maybe the price is fixed? My broker has this pair available and I did manage to put a market order on with my demo account. It's a very odd looking 5 minute chart, with lots of angles compared to the smoother flowing main currencies.
Chinese yuan (USD/CNY)
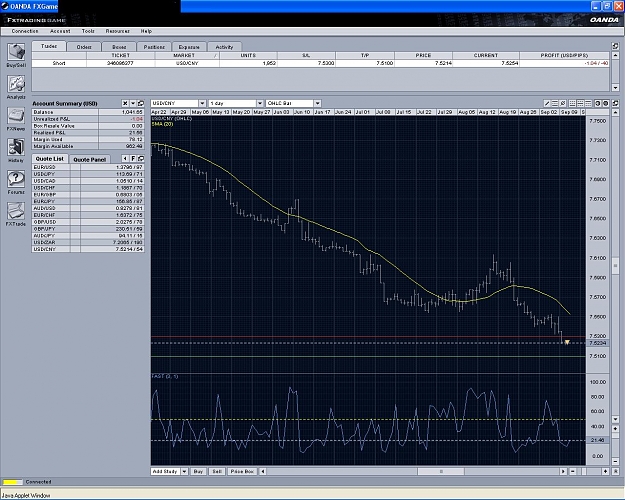
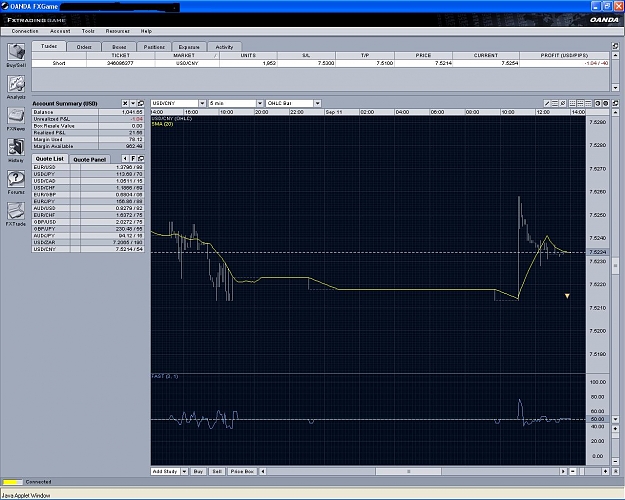
- Marrethiel replied Sep 6, 2007
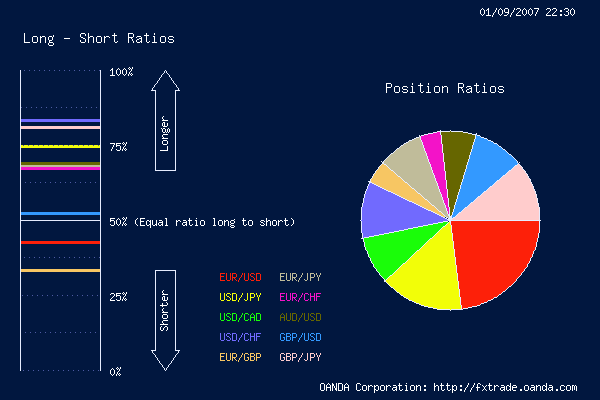
EUR/USD: too close to 50% USD/JPY: long -38 pips USD/CAD: long -48 pips USD/CHF: long -78 pips EUR/GBP: short -15 pips EUR/JPY: long +23 pips EUR/CHF: long -26 pips AUD/USD: long +125 pips GBP/USD: too close to 50% GBP/JPY: long, +94 pips, contract ...
DEMO idea for a dead simple system.
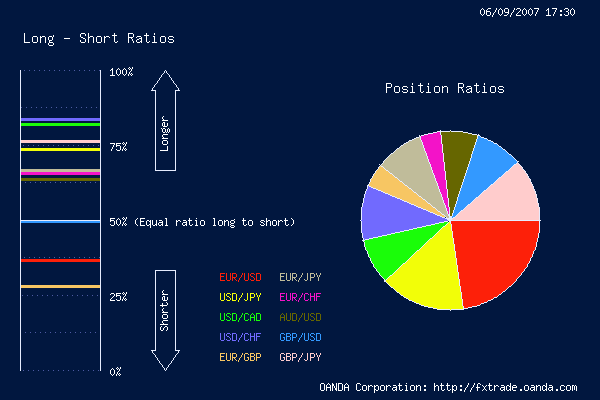
- DEMO idea for a dead simple system.Started Sep 1, 2007|Trading Journals|19 replies

Oanda has a "FX open positions" chart. I am going to open a demo account with $1,000 in it and open ...
- Marrethiel replied Aug 22, 2007
How I judge a trend — One of several ways. I trade both 5 minute and 24 hour charts so there is some variation. I think the easiest way is to go to a slower time frame from what you want to trade (if you trade 3 hour, go to a daily chart) and ...
How do you find and confirm a trend?

- Marrethiel replied Apr 11, 2007
Trade #1 — Trade #1 has entered the market, now I wait. This is the hard part. Break even is when a full bar clears the original entry point or when C1 sells. My chart has a lot less pretty lines than most that I see here. Some times I get ...
End of Day trade journal
- Marrethiel replied Mar 24, 2007
My charts seem to look a lot less cluttered than a many... I'm not sure that's good or bad
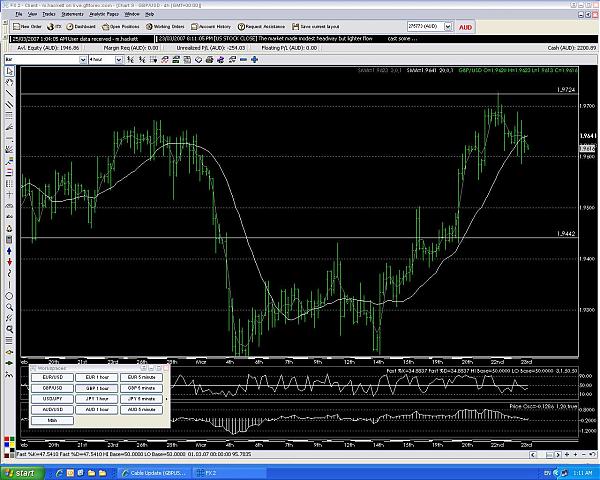
Cable Update (GBPUSD) If I were to go on the cable monday morning on a 4 hour chart it would be short: Entry 1.9607 Stop 1.9689 Limit 1.9525 If my money management rules ...
- Posts by Member Search: 'Marrethiel'