- Search Crypto Craft
- 24 Results
- Gerry replied Feb 7, 2013
Here's another. EURCAD. Took a long here too. I sold half my position at 16 pips profit and the rest went to my SL, so a smallish loss, but I still don't understand where I went wrong. I know some trades just fail... is this one of them?
B.S. Trading with Kenneth Lee
- Gerry replied Feb 7, 2013
Hi, I'd appreciate any comments or advice on the chart please. Thank you.
B.S. Trading with Kenneth Lee
- Gerry replied Jan 27, 2013
sorry, here's the chart for the above... no, I don't seem to be able to upload it. I'll try later again
B.S. Trading with Kenneth Lee
- Gerry replied Jan 26, 2013
Hi, I've done much reading in this thread, but no posting. Great thread, KL. Thanks to the other great contributors too. I've been learning SD and would appreciate any opinions on my levels or my thoughts. I like to find a S & D level on each of the ...
B.S. Trading with Kenneth Lee
- Gerry replied Jan 16, 2013
Please give me advice on how you would handle this. Right now on the EUR, the 5 min has made what I think is a good supply zone. The 4H chart is however just gone into a strong demand zone. I would like to take the 5m short, but concerned about the ...
Looking at SD on 5 min charts
- Gerry replied Jan 16, 2013
I've identified demand levels on the Aussie daily chart. Please can you give me your opinion on these? The second chart is supply levels. I wasn't sure what to do there. You'll see the one wide level I can see. Then where I have the crosses, I ...
Looking at SD on 5 min charts
- Gerry replied Jan 14, 2013
Hi, Please can you help with this query? I have looked at a particular demand level on EUR on 5min, 15min and 30min (approx. 1.3265). I can see the level on all three time frames. It's even present to a lesser extent on the 1H. My question is this: ...
Looking at SD on 5 min charts
- Gerry replied Jan 8, 2013
Hi Good Lookin, I wanted to give you an idea of what I know in case you can spot major gaps in my knowledge. I am still in early days with SD and will continue the education process. I’ll post charts for commentary by you and that will hopefully ...
Looking at SD on 5 min charts
- Gerry replied Jan 4, 2013
Hi forhisglory, Actually I never even looked at the 'reality' of it. I was just trying to correct the original chart (about 3 charts ago) that I thought were all wrong... but maybe I'm wrong... I'm going to do the same below for Hycel. Anyone ...
The 5 minute TF S&R trading system
- Gerry replied Jan 4, 2013
Only saw this now... A new high was formed, indicating reversal to uptrend. Excuse my art.
The 5 minute TF S&R trading system

- Gerry replied Jan 4, 2013
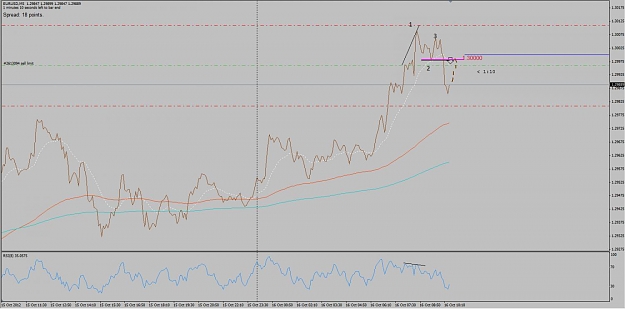
I agree with Snail. I've marked point 2 on your first chart. When the chart comes back to the 2 line (after 2 closes above) can go long. To identify point 2 in a crude way... look for a V with its sharp end pointing against the current trend.
The 5 minute TF S&R trading system

- Gerry replied Oct 16, 2012
I think you may have drawn your resistance line (sell line) off a bar chart, ie. not closing price of bar... Just look at what I've added to your chart
The 5 minute TF S&R trading system
- Gerry replied Oct 16, 2012
another — Hope no-one minds that I post an AU setup here. Here the AU seems to have done much the same as the EU.
The 5 minute TF S&R trading system
- Gerry replied Oct 16, 2012
Thank you GL. Here's one from earlier today... didn't trade it because I wasn't around. But seems to obey rules
The 5 minute TF S&R trading system
- Gerry replied Oct 11, 2012
Well, I thought I'd be okay on that long trade yesterday, though late in the trend, it was quite early in NY open, but didn't work out. Most of my losses (i figured a while ago) were because I was waiting too long and getting in late in the trend ...
The 5 minute TF S&R trading system