- Search Crypto Craft
- 30 Results
-
 Crazy-Trader replied Oct 15, 2014
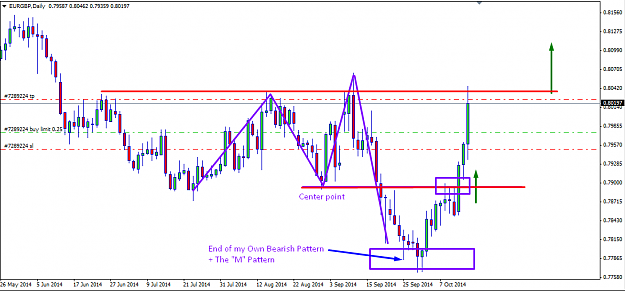
EURGBP: Center Point has been broke up... A significant upward move is expected: image
M&W-Trading
- Crazy-Trader replied Oct 12, 2014
As expected... market reacted on M base... but it seems that Center Point is to high to get reached. A pin par has been drawn on 0.7900 area. image
M&W-Trading
- Crazy-Trader replied Sep 23, 2014
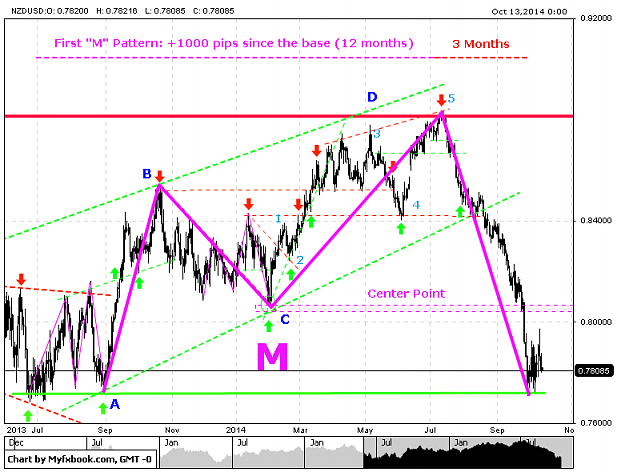
Invalided M pattern can be detected in a very simple way: This was EURUSD 2014: image This actual Market on EURGBP: image Don't be affraid to sell the lowest against 71% traders who are Long... Market is going down anyway. url Enjoy Pips!
M&W-Trading
- Crazy-Trader replied Jul 30, 2014
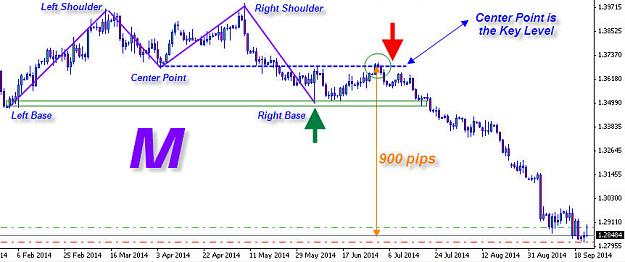
What make sens is how we drawn differently those patterns, you might be right the way they have been taugh. I probaly red once very fast this concept pattern. In fact we have to drawn them like Head & Shouders Patterns (outsite the chart). image ...
M&W-Trading

- Crazy-Trader replied Jul 29, 2014
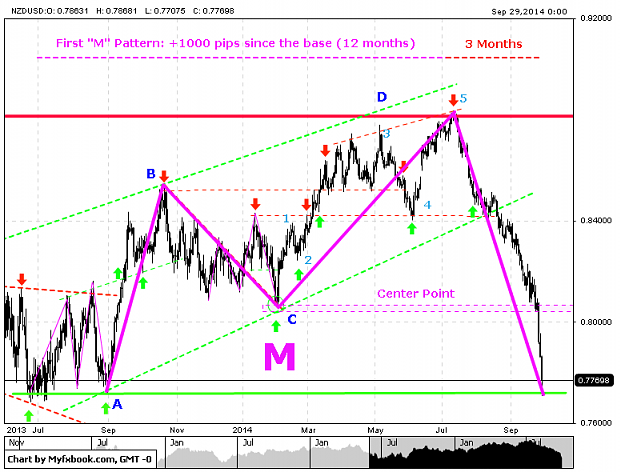
I still don't know if we do talk about the same pattern unless our different view is the interpretation on how to draw it. If you refer to Harmonics: - the bullish pattern looks like a "M" - the bearish pattern looks like a "W" The "M & W" are a ...
M&W-Trading

- Crazy-Trader replied Jul 29, 2014
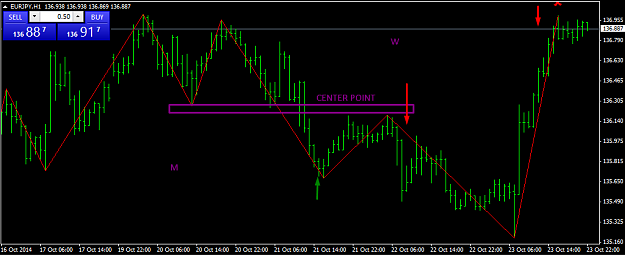
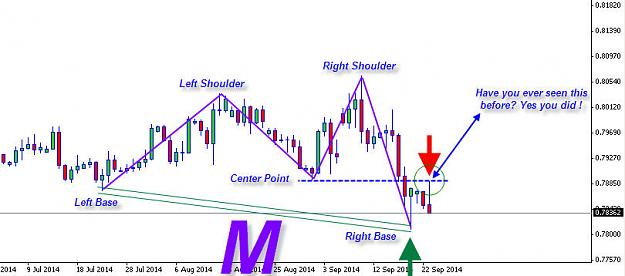
Thx NeoRio I only look at this Pattern on Daily. Looking at lower timeframe could lead to fake signals... that could be a reason he does the opposite. We have a "M" Pattern right now on NZDCAD. image How to trade it? Get a BuyLimit ready on the ...
M&W-Trading

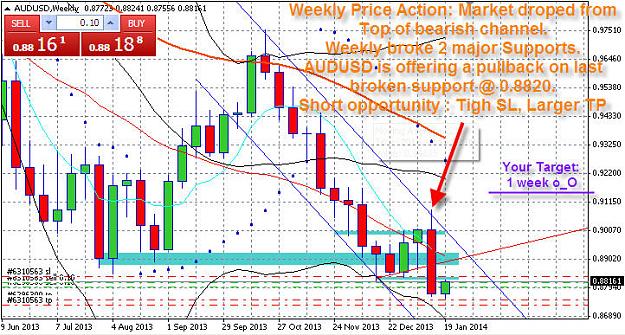
- Crazy-Trader replied Jan 22, 2014
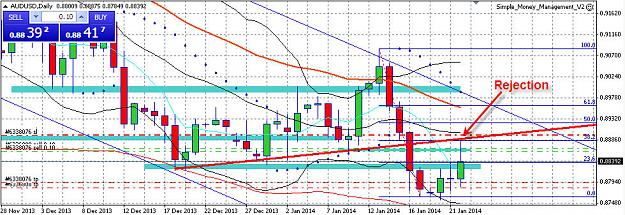
And price has been rejected from pullback @ 0.8880 as we said earlier. image
AUD/USD
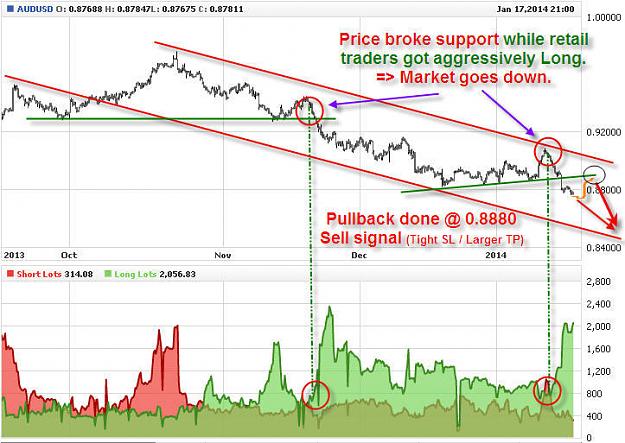
- Crazy-Trader replied Jan 20, 2014
Estimated time to reach your SL... 1 to 3 days. AUD can't even break actual resistance @ 0.8820... so to get back to 0.9150 it sounds crazy. image Good luck anyone Long.
AUD/USD
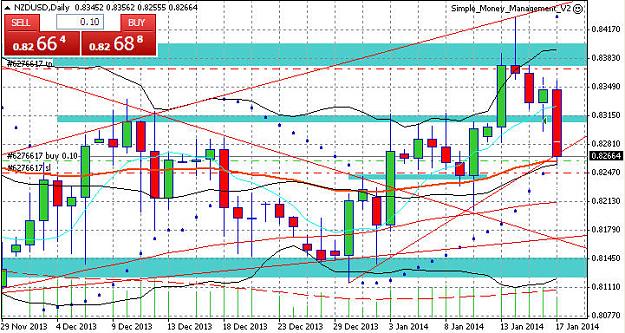
- Crazy-Trader replied Jan 19, 2014
My Long has been stopped out @ your entry.
NZD/USD I can't go short this price level... but I'm no more long for the moment image

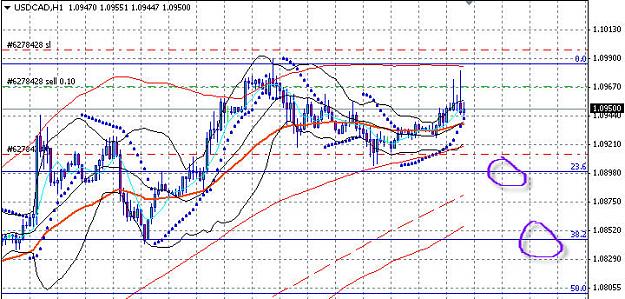
- Crazy-Trader replied Jan 17, 2014
Not today : ( I took a little short near resistance level becasue it seems like USDCAD needs to breath and retrace on 23 or 38% Fib before crossing that psychological barrier 1.10 image
USD/CAD
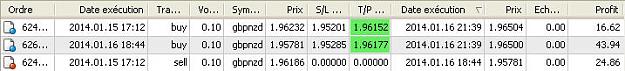
- Crazy-Trader replied Jan 16, 2014
One of my broker is so bad as well for spread but I can't complain this time as he offered me 67 free pips on both gbpnzd as it was running out of liquidity on news released. image
NZD/USD
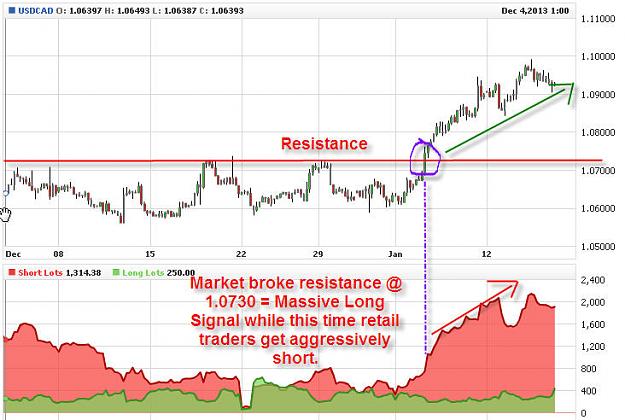
- Crazy-Trader replied Jan 16, 2014
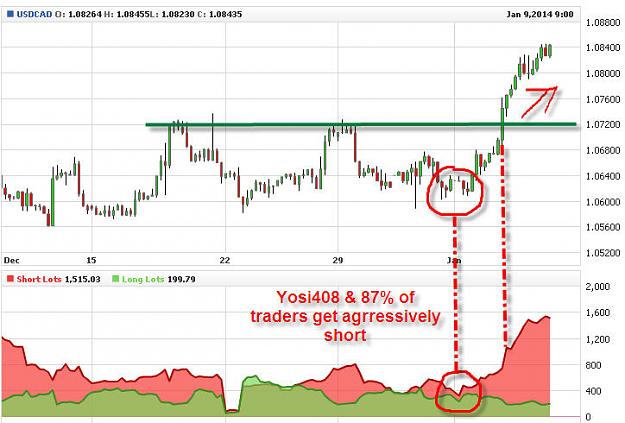
This is the opposite: It is important to understand this. Market is going up... Retail traders start to go short Market is going down... Retail traders start to go long Here an example with USDCAD: Still 80% retail shorts. WHY? image If you wonder ...
NZD/USD
- Crazy-Trader replied Jan 16, 2014
I'm long into a bullish Market and I'm waiting a retest of 38% fib retracement @ 1.0850 area. image
USD/CAD

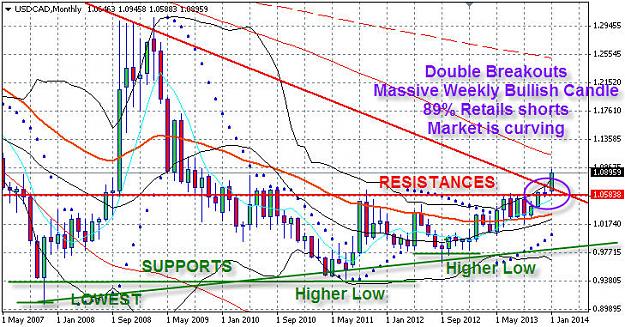
- Crazy-Trader replied Jan 11, 2014
Look left, market leaves clues. Never trade what you think... Market don't give a s*** what you think. Look at Monthly chart. If you can't admit this is a bullish market... You better better not trade this pair for a while. image
USD/CAD
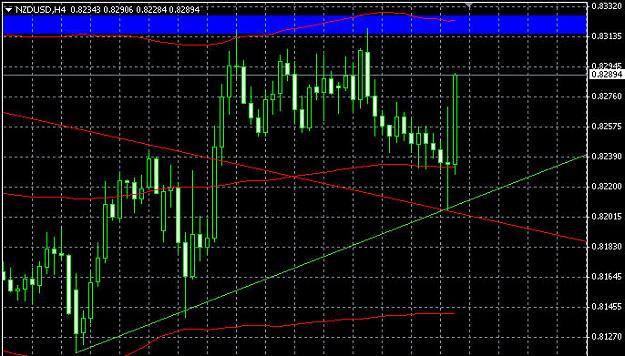
- Crazy-Trader replied Jan 10, 2014
Nice pullback for Bullish Momemtum on support confluence point @ 0.8200 area. NFP helped to push higher. image
NZD/USD
- Crazy-Trader replied Jan 9, 2014
Keep wishing... this is how 13% long traders are making profit. Whose going to pay us if nobody sells? o_O By experience I would say USDCAD won't retrace before Monday. image Some traders are so bad that they started to short before the resistance ...
USD/CAD