- Search Crypto Craft
- 21 Results
-
 BernieMadoff replied Mar 17, 2011
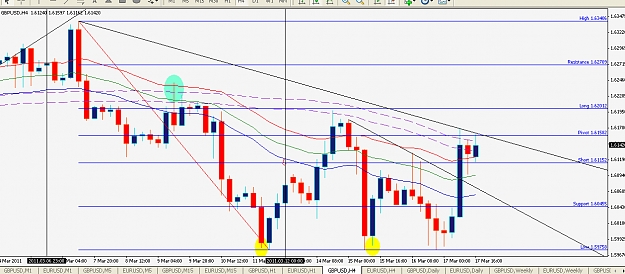
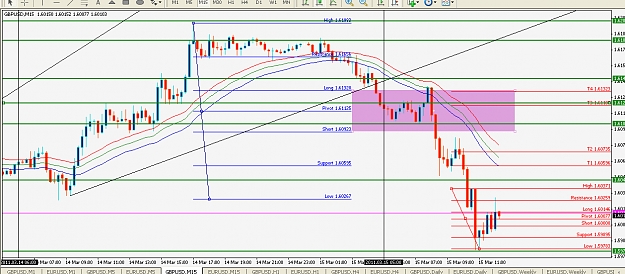
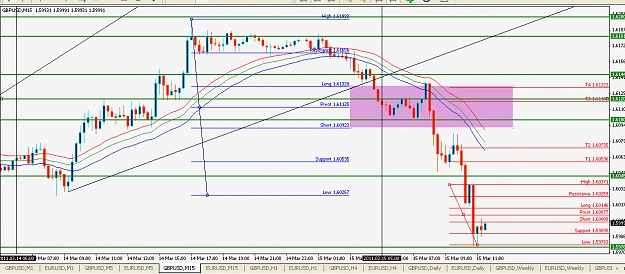
As mentioned earlier, the 4hr chart was saying long by their candle signals. the 4hr chart range fib surpassed the short level, and is scouting for the pivot @ 6158. The market has to break this level and the 4hr tl before it can reach its ultimate ...
Fibonacci Trading with Bobokus
- BernieMadoff replied Mar 17, 2011
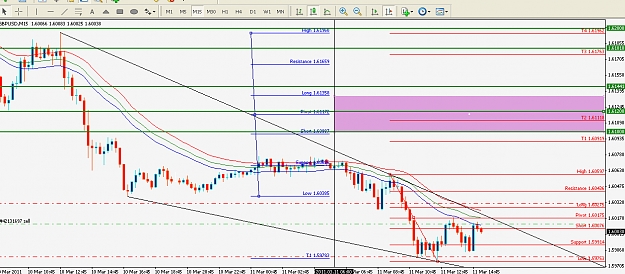
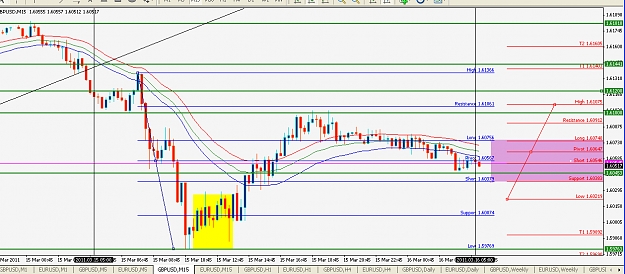
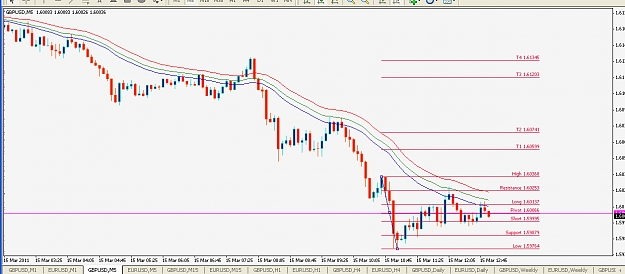
Price is testing the intraday short. The break of this level means no buy can be taken. It is too much resistance (6035, 6045, 6048, and 6053) to surpass before a buy can even be considered. But if price brake all these levels by london open, we can ...
Fibonacci Trading with Bobokus
- BernieMadoff replied Mar 16, 2011
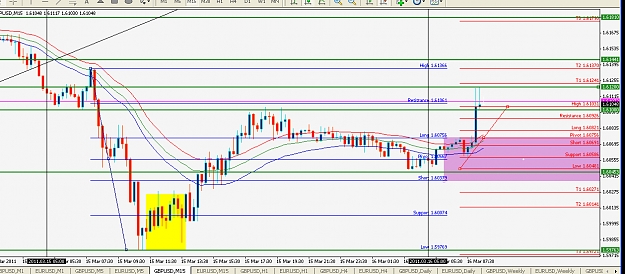
We have another consolidated battle going on like yesterday. Bears is stopping the bulls at the 20 and the bulls is holding the bears at the 80. We need to break out of the yellow box. But this consolidation is paying with nice scalps.
Fibonacci Trading with Bobokus
- BernieMadoff replied Mar 16, 2011
It appears the 80 is going to hold as support. the fibs never lie. and that where the short level was. :nerd:
Fibonacci Trading with Bobokus
- BernieMadoff replied Mar 16, 2011
Ask you can see the psych level is stopping the bulls once again at the 20.
Fibonacci Trading with Bobokus
- BernieMadoff replied Mar 16, 2011
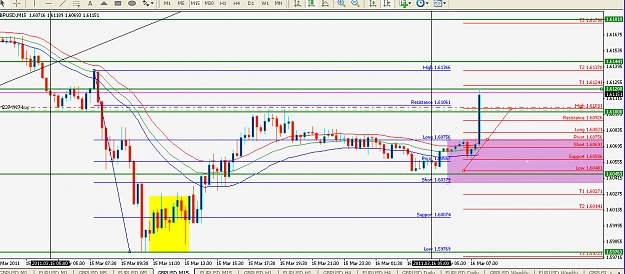
Here we go. Its going for first the intraday high of 6136, Then the 4hr high of 6202 if the us session is controlled by the bulls.
Fibonacci Trading with Bobokus
- BernieMadoff replied Mar 16, 2011
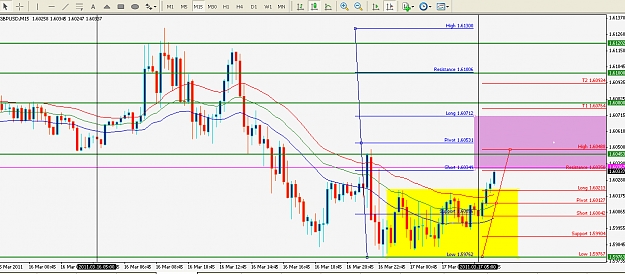
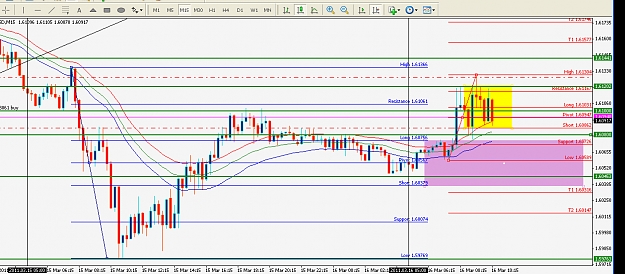
We are looking for the bulls or bears to take control. And what we are looking for for the bulls is for price to break (open above) the trendlines on the 1hr and 4hr charts. But a real confirmation would be the break of 6075 the intraday long and ...
Fibonacci Trading with Bobokus
- BernieMadoff replied Mar 15, 2011
As you can see by the yellow and aqua circles, the bulls did it again. But we aren't surprised, knowing that this was a key level of support. And we also know what high they are going after, right? Yes, you got it: 6202. print money peoples. :nerd:
Fibonacci Trading with Bobokus
- BernieMadoff replied Mar 15, 2011
cable is ranging. Lets see if this impending news can push it out of the yellow box.
Fibonacci Trading with Bobokus
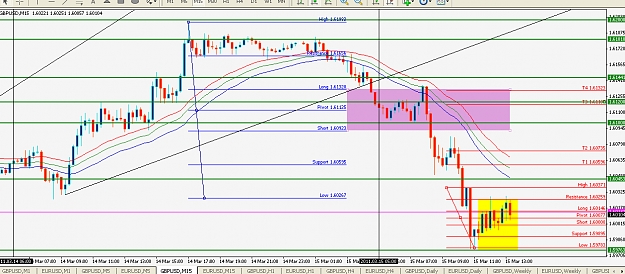
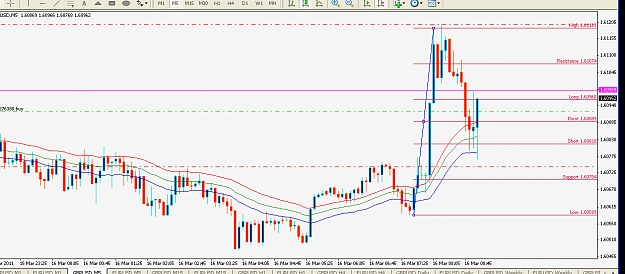
- BernieMadoff replied Mar 15, 2011
breaking it down to the 5min tf, we can clearly see the bull/bear battle taking place. :nerd:
Fibonacci Trading with Bobokus
- BernieMadoff replied Mar 15, 2011
The bulls tried to get it over 14 the last 15min period but failed. This resistance may hold. Lets see if the bears can try for them lows again.
Fibonacci Trading with Bobokus
- BernieMadoff replied Mar 15, 2011
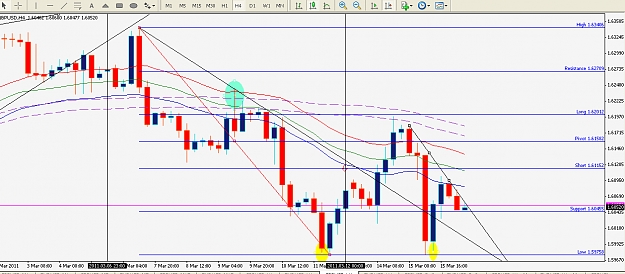
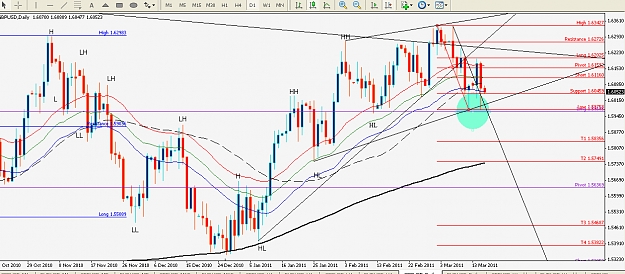
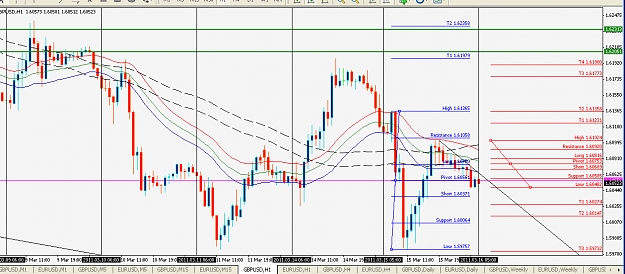
4hr and daily charts. The previous two is 15min and 1hr charts. :nerd:
Fibonacci Trading with Bobokus
- BernieMadoff replied Mar 15, 2011
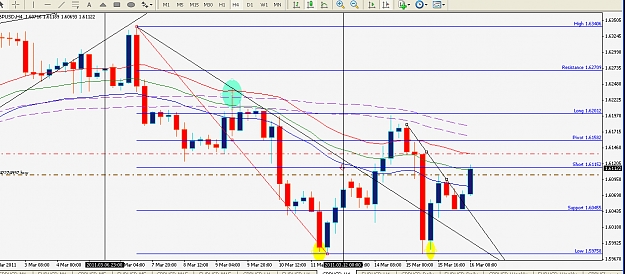
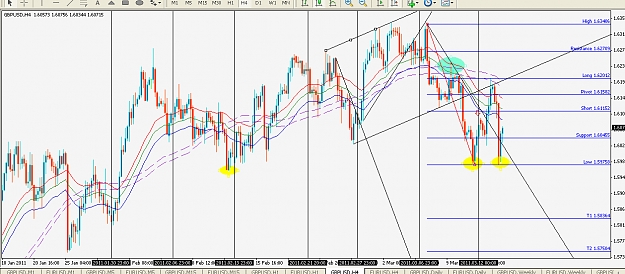
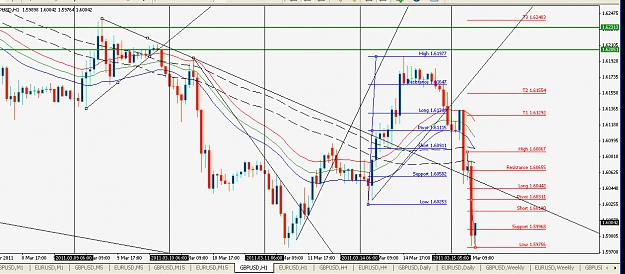
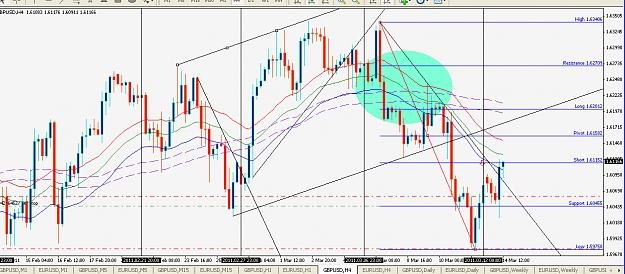
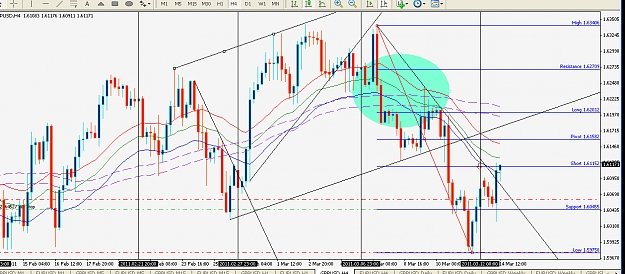
As you can see by these four charts, price has climbed to the 6202 level as predicted, where the bears was waiting to take over and drop it to the low made on 2/11(5962). Price once again fell to the swing low of 5975 and the major down trend long ...
Fibonacci Trading with Bobokus
- BernieMadoff replied Mar 14, 2011
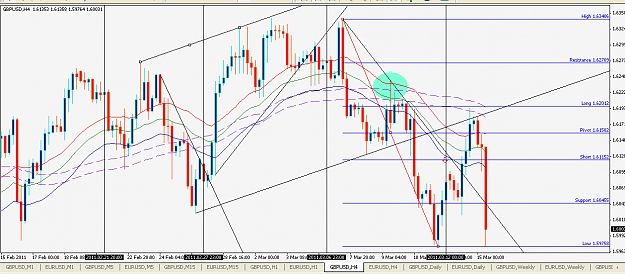
We should see a bounce of one of these swing levels as price attempts to go after this March 9 high on the 4 hr chart. But 6202 is the daily swing long fib. The bears may say that's it right here.
Fibonacci Trading with Bobokus
- BernieMadoff replied Mar 14, 2011
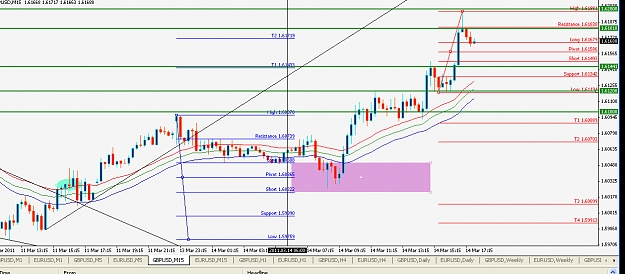
The market traded up to the levels I mentioned earlier and was held. Shall it surpass this area with a strong bull move? Or drop to the low(s) mentioned.
Fibonacci Trading with Bobokus
- BernieMadoff replied Mar 13, 2011
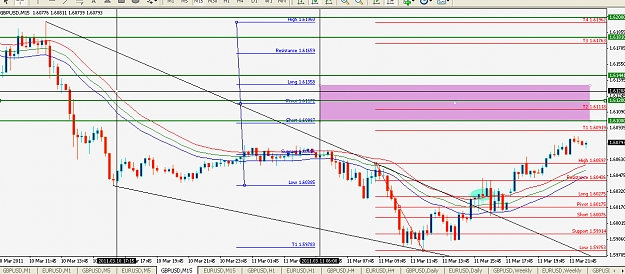
The pound almost reached the swing T1 on friday @6091. I am looking for it to trade up to friday's intraday (blue fib) pivot @6117 and being stopped by the sellers between 6116 - 6120. There is a lot of resistance in this area from the 15 min to the ...
Fibonacci Trading with Bobokus
- BernieMadoff replied Mar 11, 2011
Still trying to reach upper levels. Its too late in the day for it to rise above this high. :nerd:
Fibonacci Trading with Bobokus
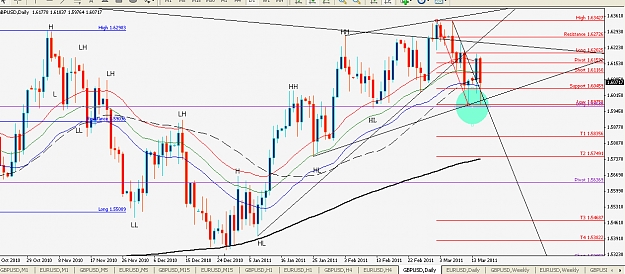
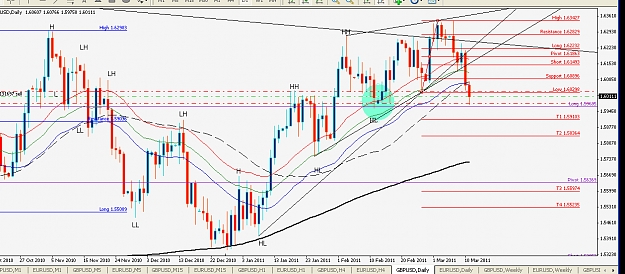
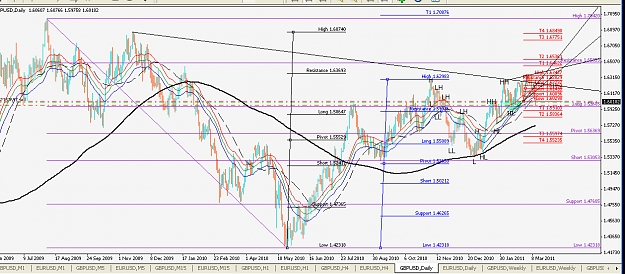
- BernieMadoff replied Mar 11, 2011
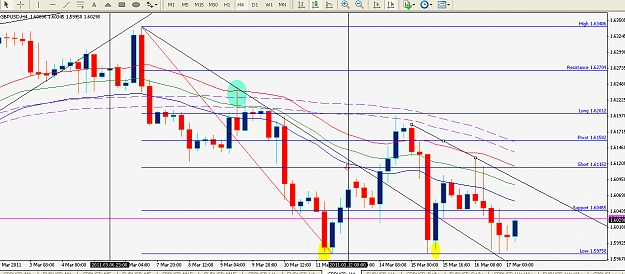
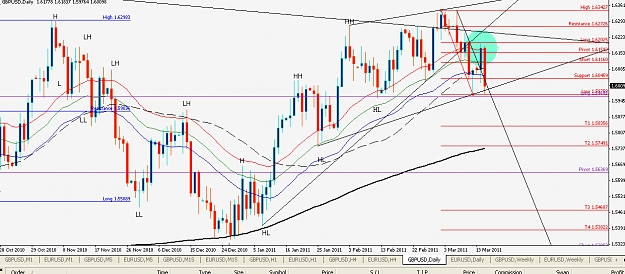
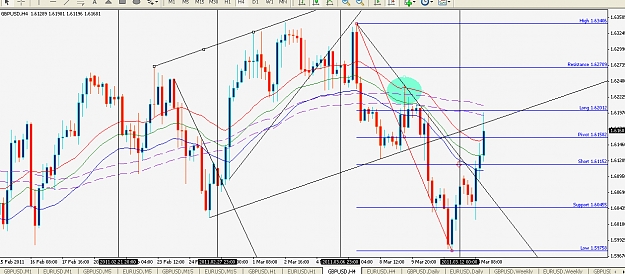
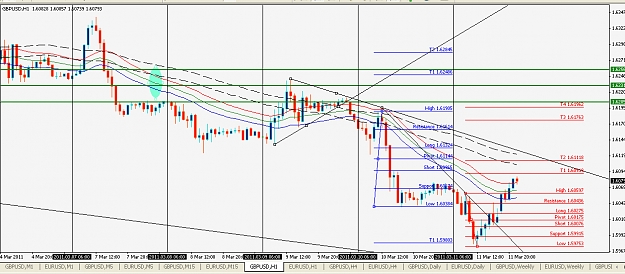
As you can see from the daily chart, price is in a sellers market (immediate). It is currently trying to get pass the 2/11 low of 5962 (green circle). At 5968 we have the major down trend (8/4/09 - 5/20/10) long level acting as added support (lower ...
Fibonacci Trading with Bobokus
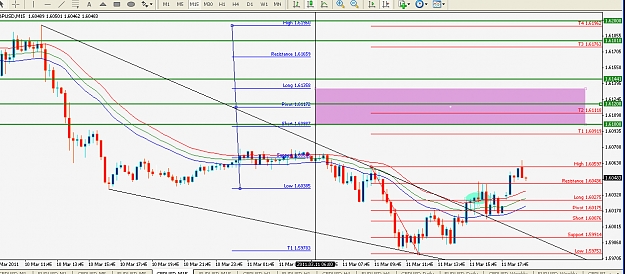
- BernieMadoff replied Mar 11, 2011
Price is caught between the swing pivot and the intraday T1. This is still a sellers market. :nerd:
Fibonacci Trading with Bobokus