- Search Crypto Craft
- 28 Results
-
 2hpriest replied Apr 12, 2023
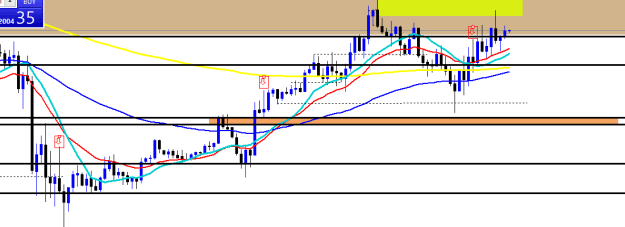
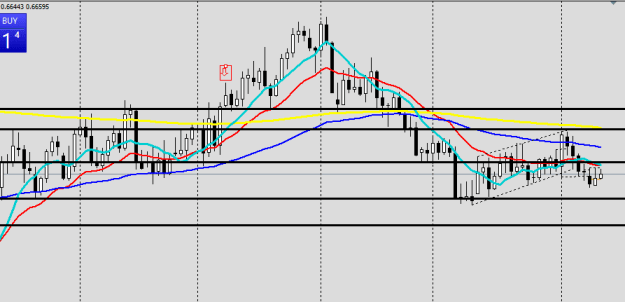
image image Greetings Strat, Please in the above charts Gold and AUDUSD, which of the arrowed candles meet your description of your what this candle should be? This will help me better understand them profitably. I want to believe that in ...
Strat's PASR Long Term, Stress Free Trading
- 2hpriest replied Apr 4, 2023
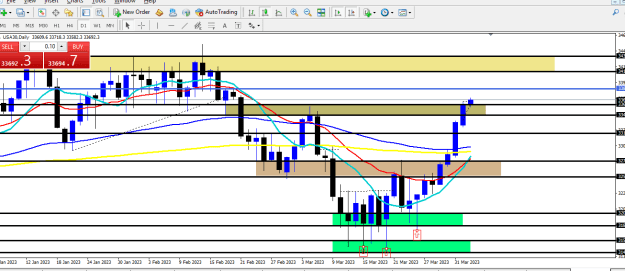
image Hi Bistoils, Was looking at this US30 daily chart(from your posts lately you seem to have a knack for this particular indices). For educational purposes. Assuming you were still trading the daily timeframe, which of the 3 hammers would you ...
Strat's PASR Long Term, Stress Free Trading
- 2hpriest replied May 11, 2021
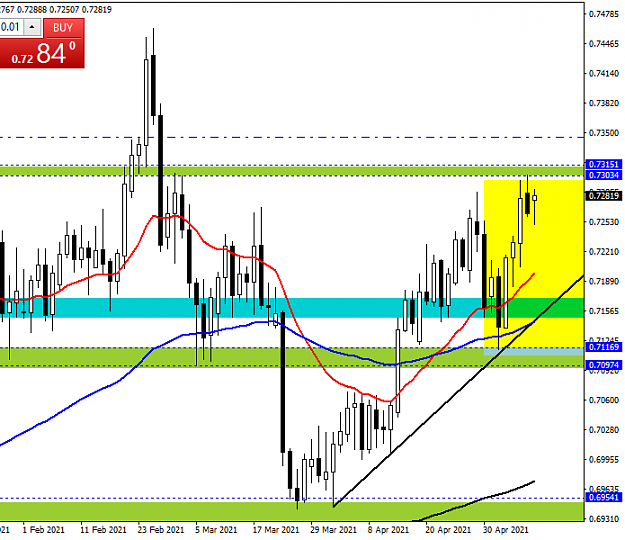
image TerryDawe, Your analysis are always simple, logical and impacting. Thank you Looking at the attached chart and considering that price seems to be stalling at a resistance level which coincides with the high of last weeks' candle (which we ...
Strat's PASR Long Term, Stress Free Trading
- 2hpriest replied Apr 14, 2021
image image image Mine is an illustration of what one sees as different from what the market gives. When i entered this trade, I had seen on the BB, what looked like the readiness of sellers to take back the reign of power with the price ...
Strat's PASR Long Term, Stress Free Trading
- 2hpriest replied Mar 26, 2021
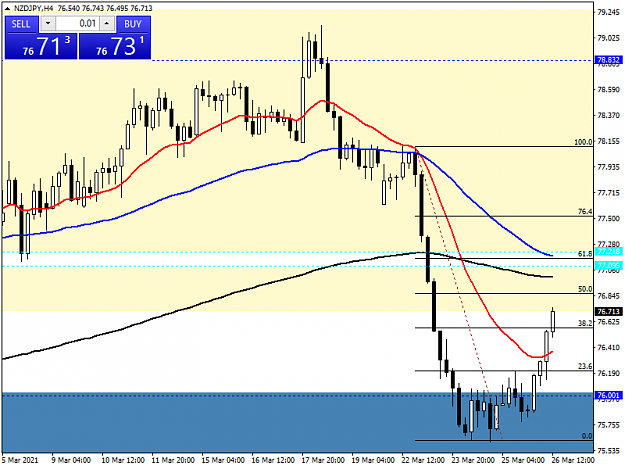
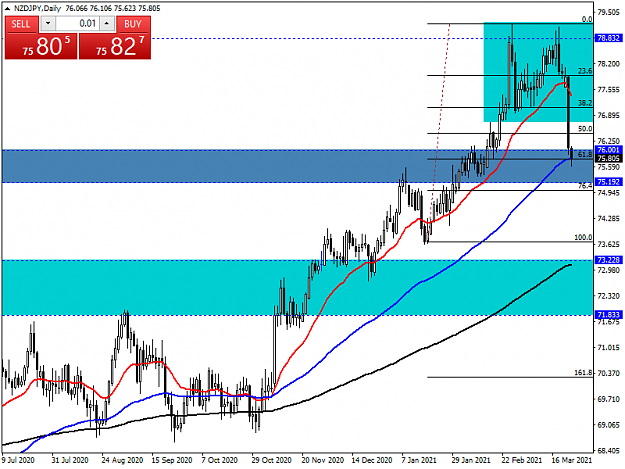
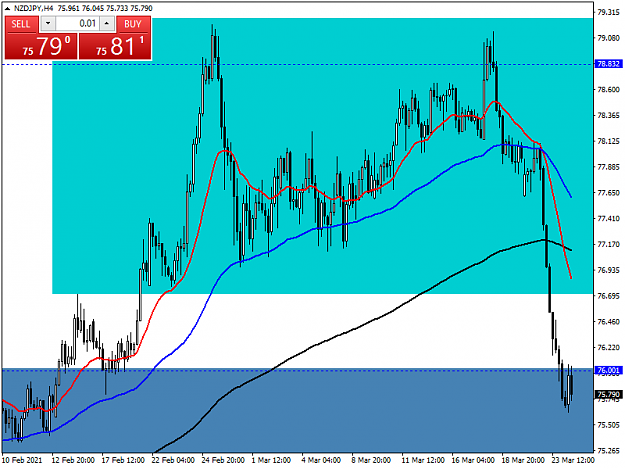
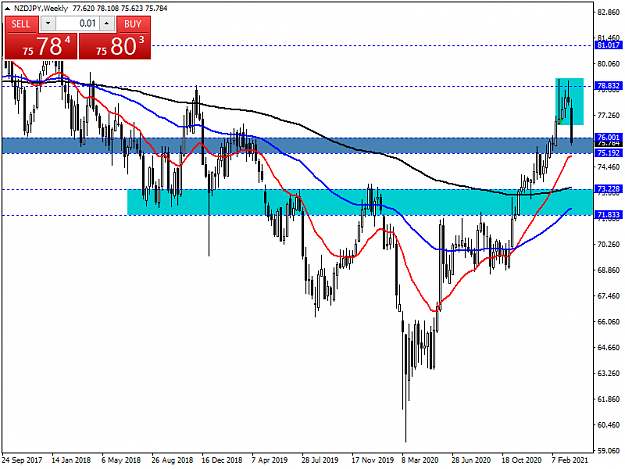
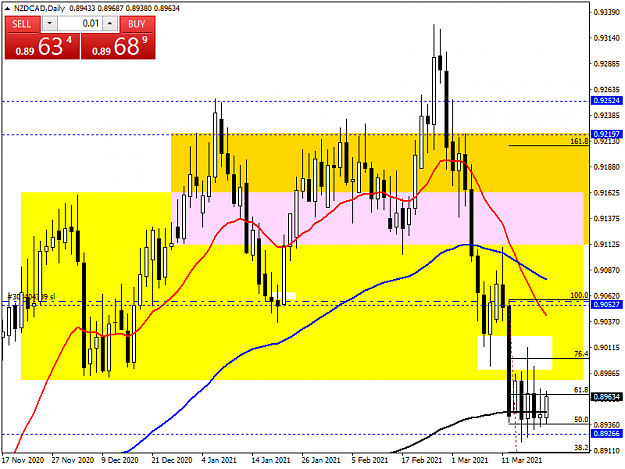
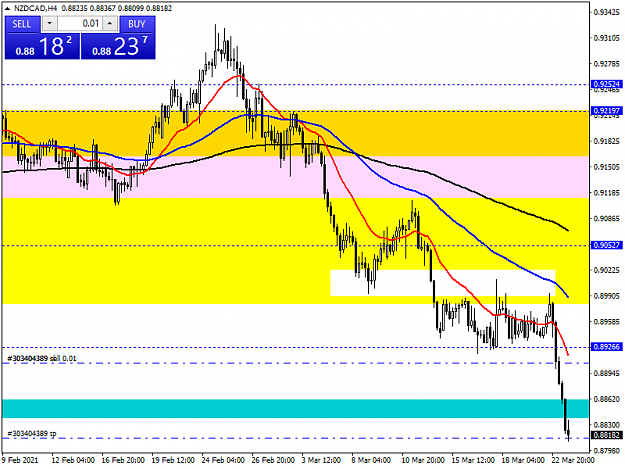
image Still on this trade. Advise given earlier was to follow the trend, the primary trend which is bearish. 'Coming down to the H4, the last BUEB/BUOB is the only sign that the buyers could make a return. This is where i need your help. Is this ...
Strat's PASR Long Term, Stress Free Trading
- 2hpriest replied Mar 26, 2021
image image Just for learning purpose. What makes an SNR tradeable? Ofcourse, we have been told that they are not necessarily a single line on the chart but zones on the chart. If that is true, then the Boss chart has an SNR zone as coloured in ...
Strat's PASR Long Term, Stress Free Trading
- 2hpriest replied Mar 24, 2021
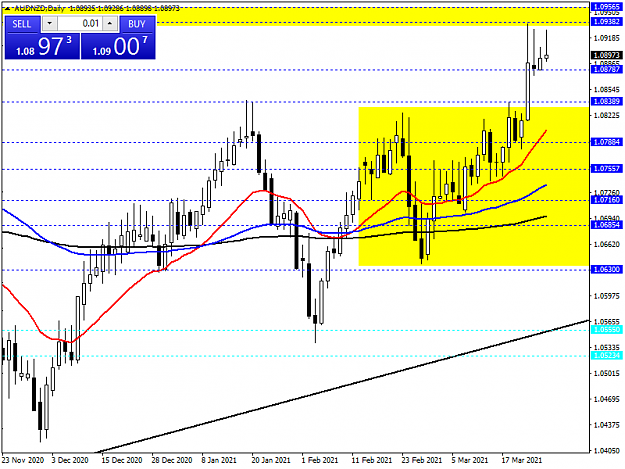
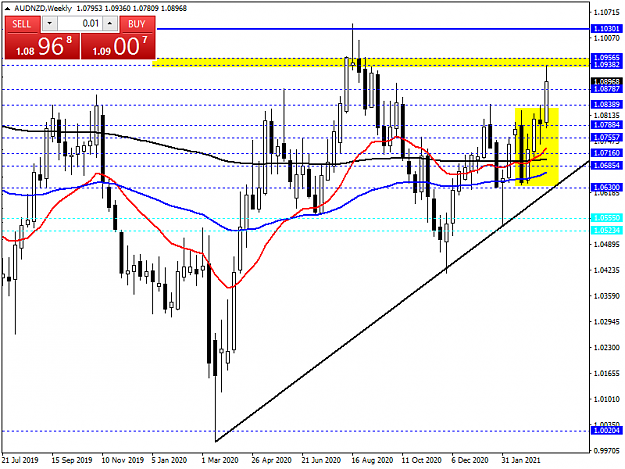
image image image Back to PASR trading. The Boss has broken out of WCC, with the strong BEOB/BEEB. It is testing a strong SNR zone , with the top of the Strat shadow acting as support. We have 2 more days before the week closes and that could ...
Strat's PASR Long Term, Stress Free Trading
- 2hpriest replied Mar 23, 2021
image image The emphasis here is my BROKER. Looking at the 4hr chart, Will it not surprise you that i am yet waiting for my TP to be hit, even when it is clear as daylight that the wick touched and crossed it. But even as i write my broker has ...
Strat's PASR Long Term, Stress Free Trading
- 2hpriest replied Mar 19, 2021
image We are putting our money where our mouth is (or where BG fib strategy is). The only worry here is that the primary trend is bullishly strong. My risk to return at 152p SL to 98p TP should call for my head to be checked. However, like most ...
Strat's PASR Long Term, Stress Free Trading
- 2hpriest replied Mar 19, 2021
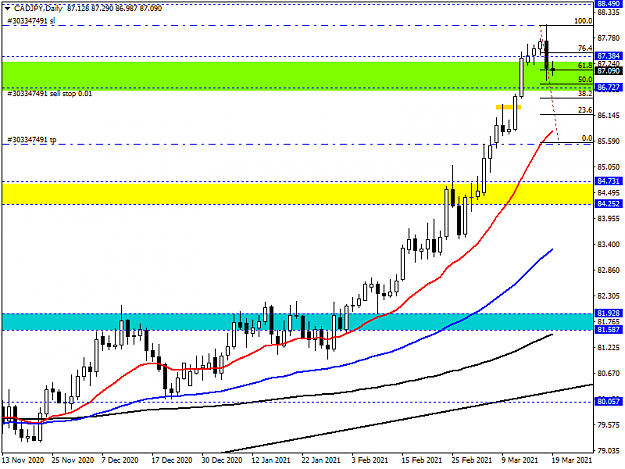
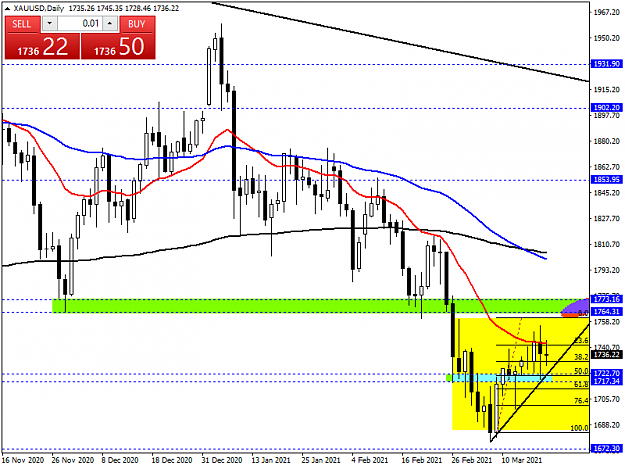
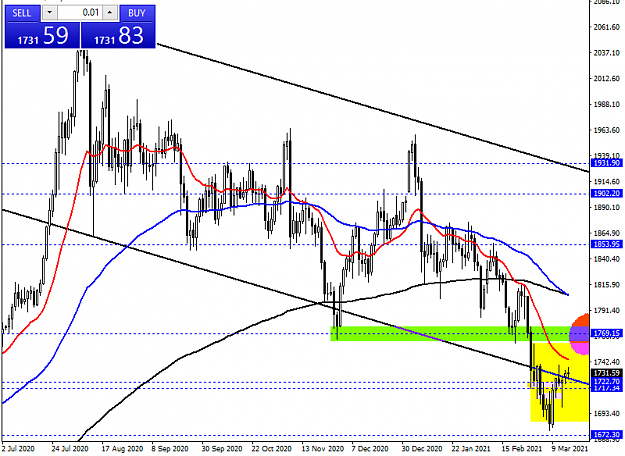
image Still on the XAUUSD earlier post this week. Applying BG fib strategy on it, we see the 0 fib tallying with the high of the current WCC. At for a learner, i am admonished to buy at the bottom and sell at the top of the WCC. When we justaxpose ...
Strat's PASR Long Term, Stress Free Trading
- 2hpriest replied Mar 19, 2021
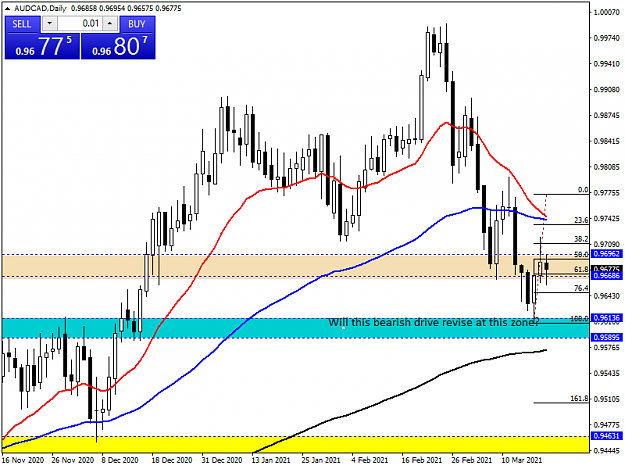
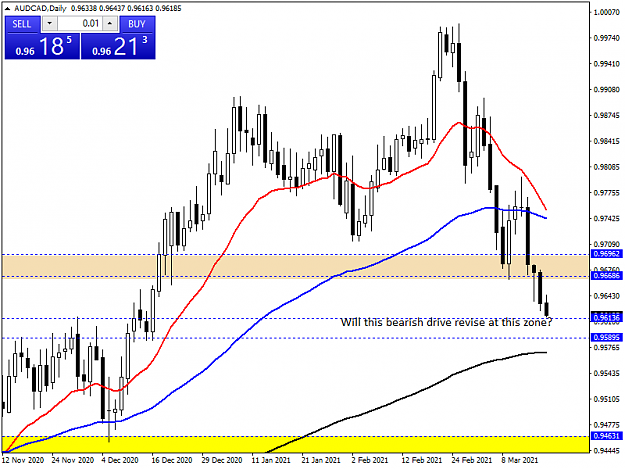
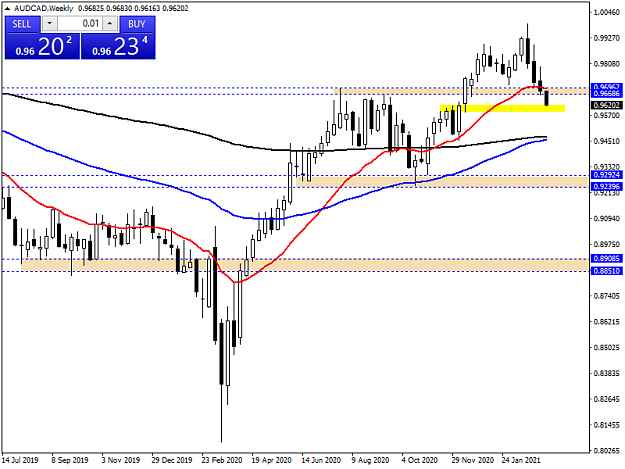
image As a follow up on my earlier post on this AUDCAD trade. The revise did happen on the SNR zone as highlighted in the above chart. According to my broker chart, the candle formed at this revisal is a BUOB. How far this pullback in a pullback ...
Strat's PASR Long Term, Stress Free Trading
- 2hpriest replied Mar 17, 2021
image image The big boss is engulfing last month shooting star although this can only be confirmed if it closes same at the end of the month. The boss is in a downward correction(immediate trend) but presently inside the Strat shadow. The worker ...
Strat's PASR Long Term, Stress Free Trading
- 2hpriest replied Mar 17, 2021
image Hi Terry, Congrats on this trade. Have been trying to look through your mind to see what you saw before taking this trade. Was it that you bought into the 200 Ema because price has not closed above it when you bought or was it a buy stop ...
Strat's PASR Long Term, Stress Free Trading
- 2hpriest replied Mar 16, 2021
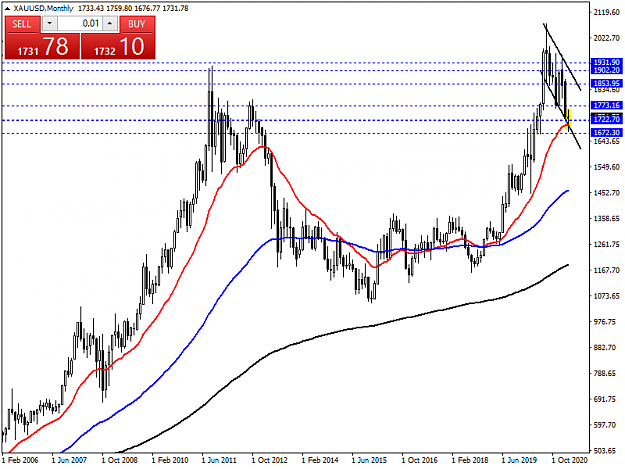
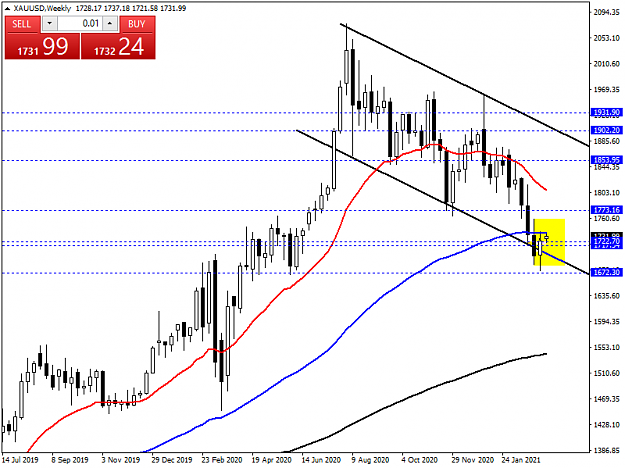
image image image Gold(XAUUSD). The immediate Big Boss trend is down. This is after reaching an all time high last July. Presently it below 2011 highs and testing the strat shadow. The question is how far will this retracement (pullback) go ...
Strat's PASR Long Term, Stress Free Trading
- 2hpriest replied Feb 18, 2021
I agree with you Strat. A wanderer has indeed returned. And this time, i have come back to stay. learn and understand PASR. image i guess, that with the way the Boss candle is quickly turning to a a doji, it might continue to the upside. Since its ...
Strat's PASR Long Term, Stress Free Trading
- 2hpriest replied Feb 18, 2021
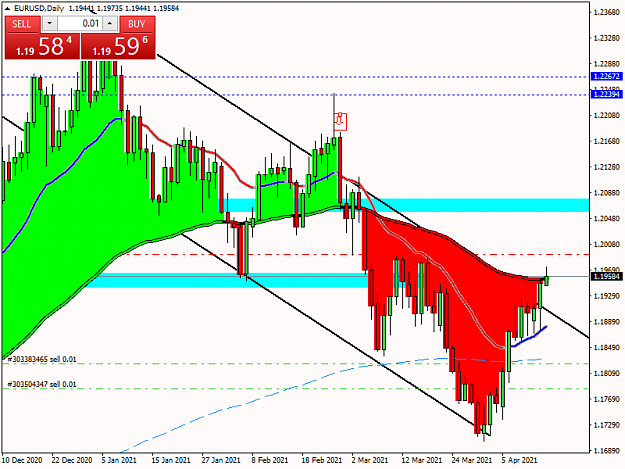
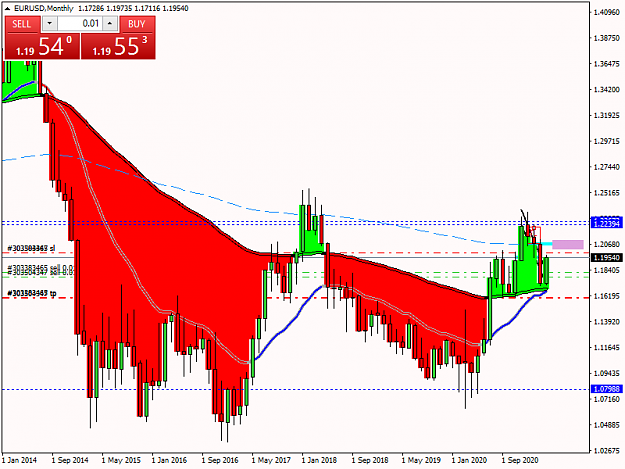
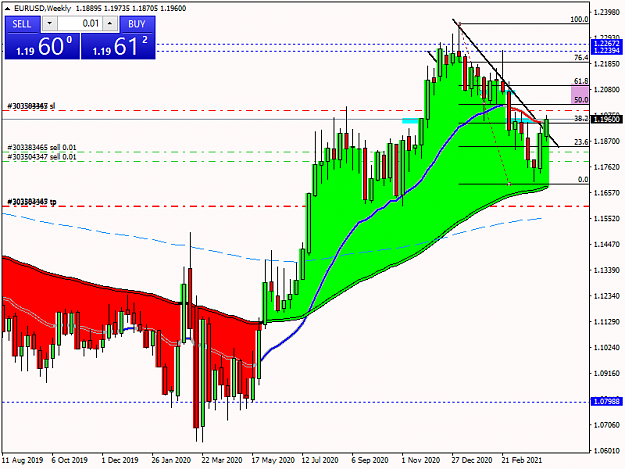
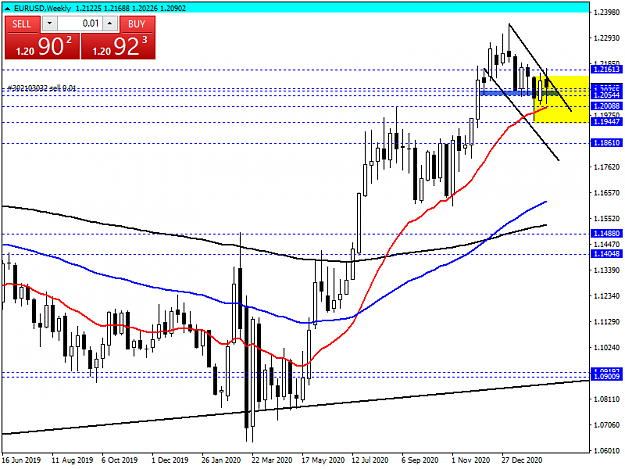
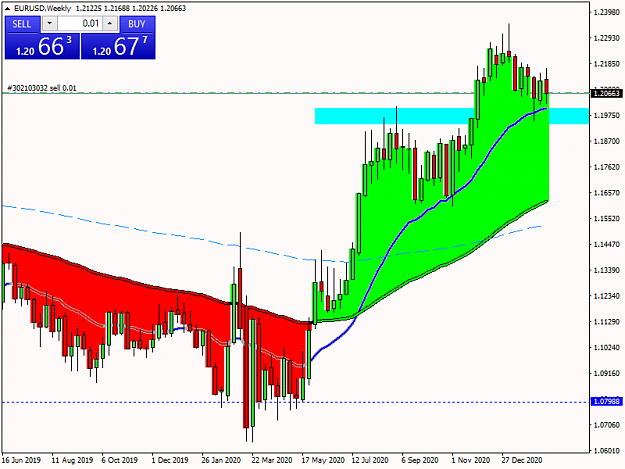
The Big Boss broke out of longterm downward trendline in June 2020 going from red to green Strat Shadow. It tested the Strat Shadow as support and made a higher high after. Presently its being rebuffed when it made an attempt to test the last high. ...
Strat's PASR Long Term, Stress Free Trading
- 2hpriest replied Jun 28, 2018
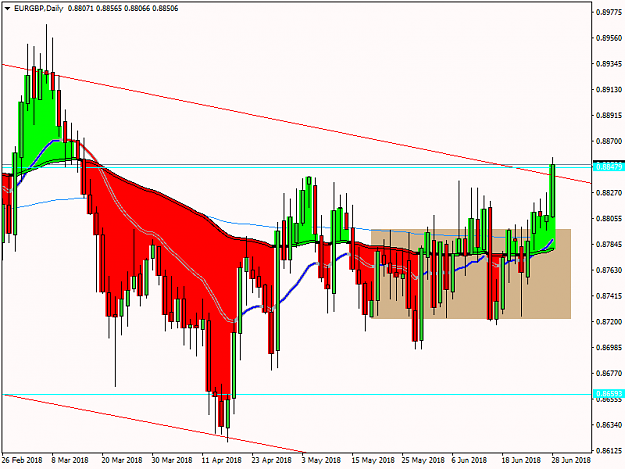
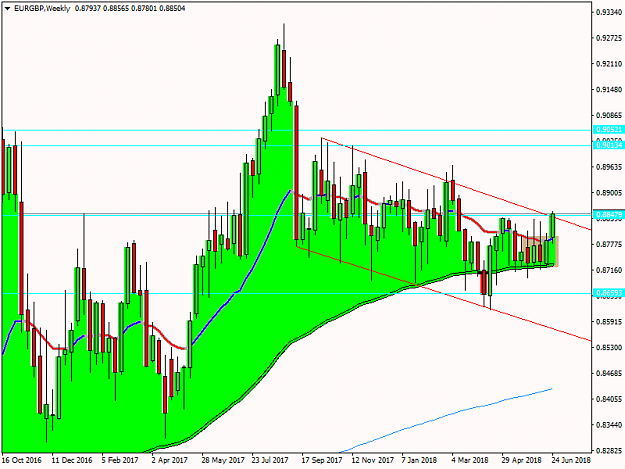
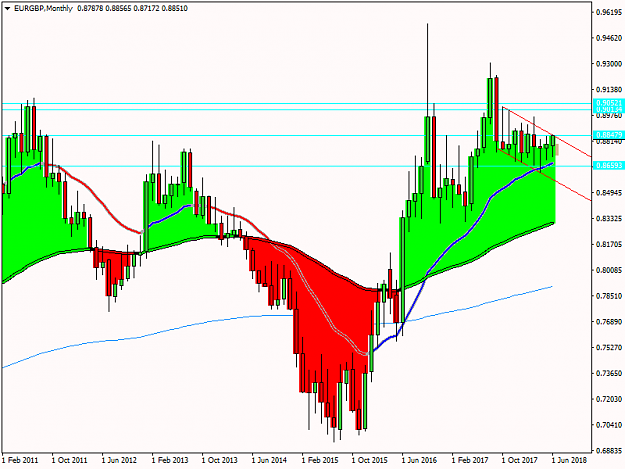
A possible trade on EURGBP. Big Boss. We have a likely bullish hammer-like candle forming - this will be confirmed at the close of markets 2moro. This bond like hammer is presently at a confluence of the intersection of a major Resistance and a ...
Strat's PASR Long Term, Stress Free Trading
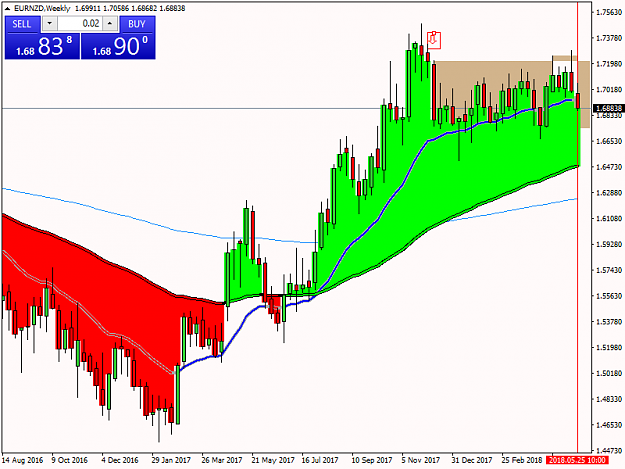
- 2hpriest replied May 25, 2018
My friend, I want to use this opportunity to express my heartfelt gratitude and appreciation For the interest and concern you, Rufus and Sabbah showed in getting my chart Strat Shadow-fied. Through PM's and Skype charts. Behold the new chart. The ...
Strat's PASR Long Term, Stress Free Trading
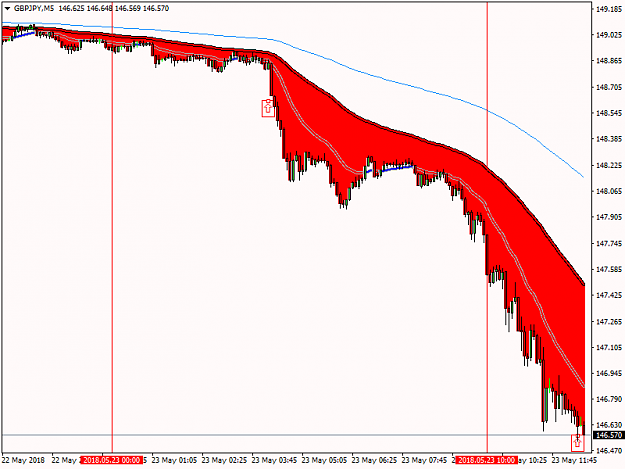
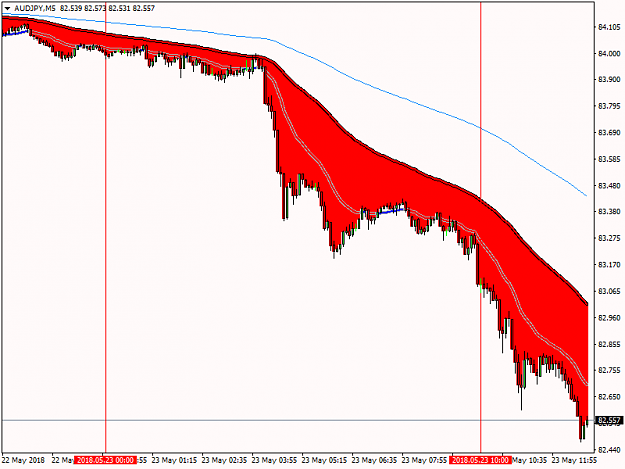
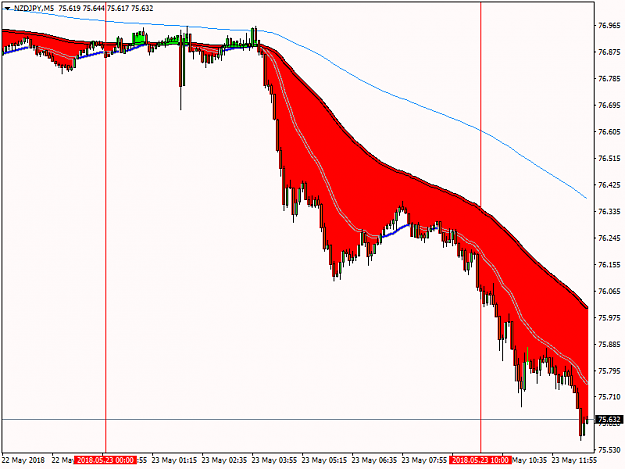
- 2hpriest replied May 23, 2018
In the spirit of Traders helping Traders, and for academic enlightenment purposes, I would love for our M5 expert traders in the house To look at the below charts and show us where they would have entered and exited each trade. I believe that this ...
Strat's PASR Long Term, Stress Free Trading
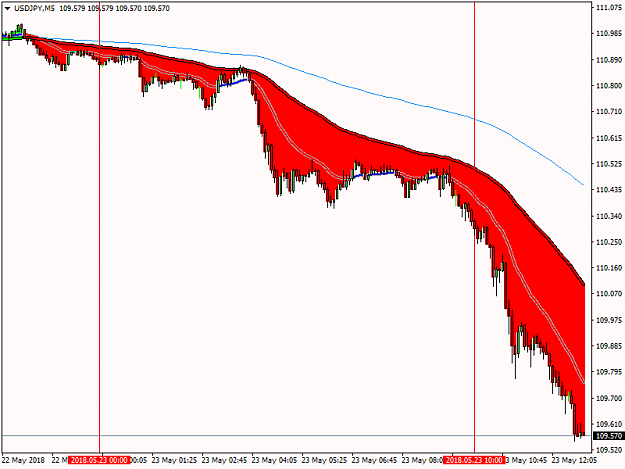
- 2hpriest replied May 23, 2018
image Just imagining what it would have been like seeing this before it happens. Entering at the BEEB as marked and closing out accordingly How many pips are we looking here? Strat M5 Trend Trading is indeed the bomb. NB. It is yet on the downward ...
Strat's PASR Long Term, Stress Free Trading